Why China’s Domestic Demand Won’t Recover — The K-Shape and an Investing Map (Views 3)
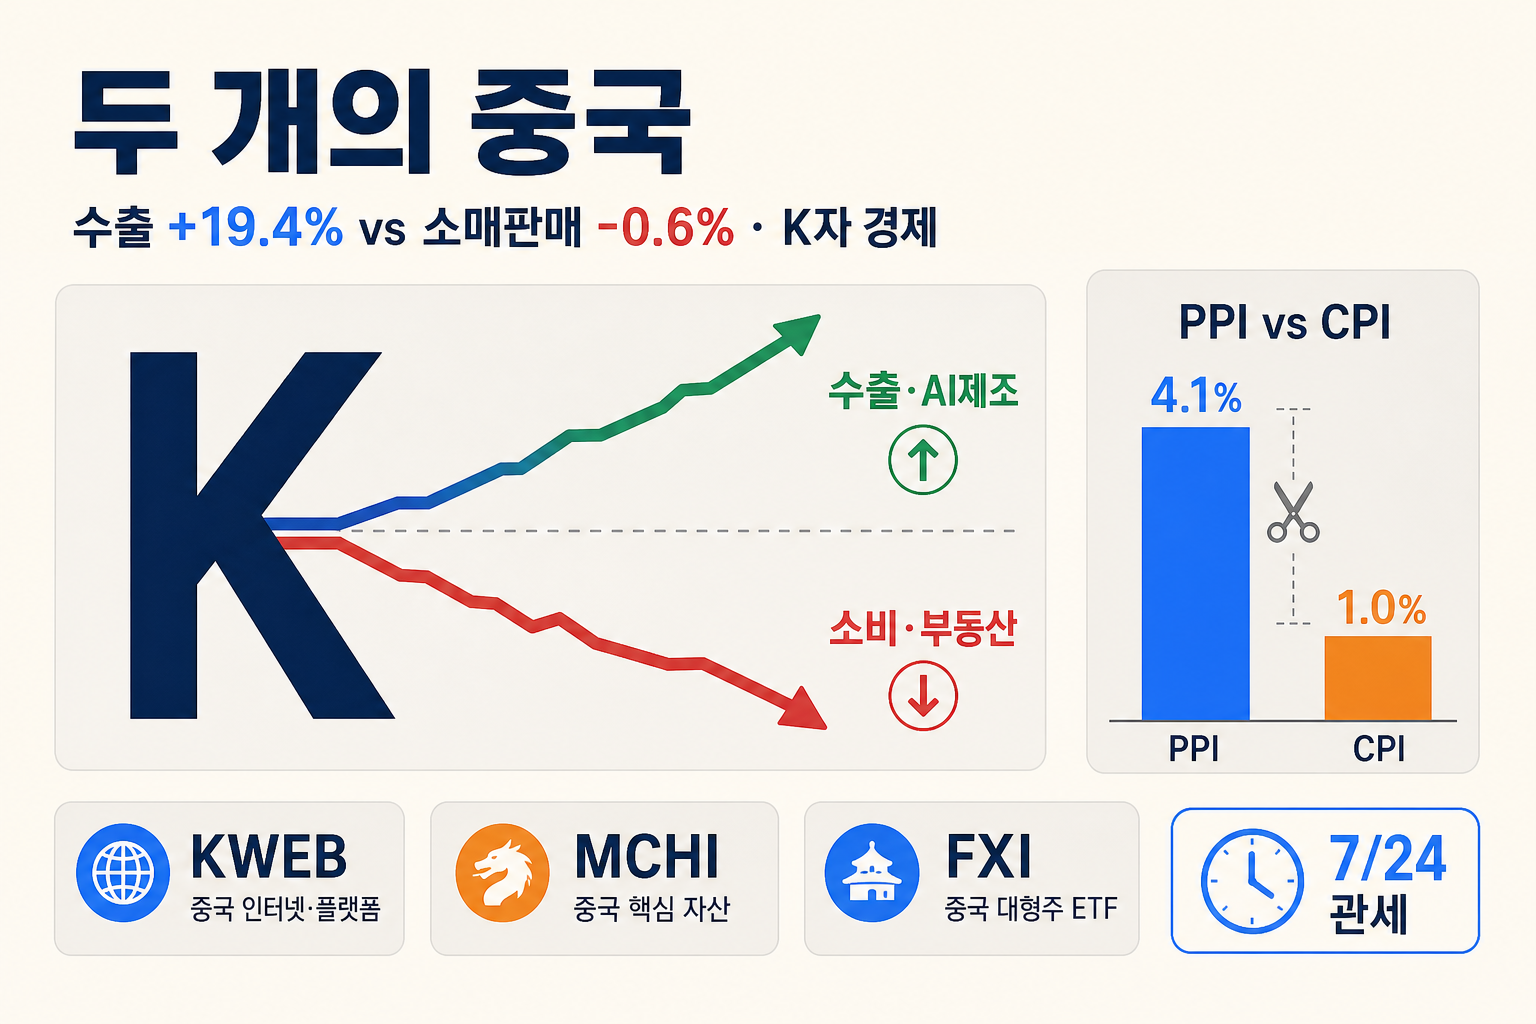
“China’s domestic demand is weak” — you hear it constantly. Yet it’s strange: over the same period, China’s exports rose +19.4% year-on-year and industrial output +4.5%. The factories are humming, so why call the economy troubled? The answer is “two Chinas.”
The upper China (exports, AI, high-tech manufacturing) runs hot; the lower China (consumption, property, jobs) runs cold. Markets call this split — like the letter K — a “K-shaped economy.” This piece covers ① the divergence in the data, ② why demand won’t recover, ③ the East Asian backdrop (PBoC, tariffs), and ④ a China ETF map. Not investment advice.
Two Chinas, by the numbers
Two Chinas YoY (%)
Bar chartChina exports industrial output PPI CPI retail sales YoY comparison. Exports, output, and PPI hold up while CPI is barely 1% and retail sales are negative — a K-shape inside one country. (Exports/output/retail May; CPI/PPI June)
The sharpest contrast is in prices. June producer prices (PPI) rose +4.1% on AI-equipment and industrial-robot demand — a fourth straight monthly gain. But consumer prices (CPI) managed only +1.0%, below the 1.1% consensus. The factory gate is hot; the checkout aisle is lukewarm. And May retail sales fell -0.6% — the first drop in 3.5 years, since the end of zero-COVID in late 2022.
The chart below shows the split at a glance: exports, output, and producer prices stand tall, while consumer prices are low and retail sales are outright negative. Within one country, the top and bottom of growth have separated — a K-shape.
Why demand won’t recover — the vicious loop
The core cause is property. Jan–May property development investment fell -16.2%, a fifth year of slump, and May new-home prices in Shenzhen dropped -4.5% YoY. When home values fall for five years, households feel their wealth shrinking; add job and income insecurity and they close their wallets and save more. Sure enough, appliances (-15.6%) and autos (-16.1%) — the categories propped up by trade-in subsidies — collapsed, the payback for demand pulled forward by policy.
When spending freezes, firms can’t pass rising costs into prices. Middle East energy jitters lift raw-material costs (PPI +4.1%), but with no pass-through to consumers (CPI +1.0%), companies fall into a margin squeeze — earning less the more they sell. Caixin’s output-price index sits at 48.2 and employment at 48.5, both in contraction. So firms cut jobs and capex (manufacturing investment -0.4%, private investment -7.1%), which loops back into income fear.
Why demand stalls — the loop
FlowChina weak domestic demand vicious cycle flow. Five years of falling property erodes wealth and confidence; households save, firms can’t raise prices, so they cut jobs and capex — which feeds back into income fear.
PBoC admits ‘structural divergence’
The notable shift is in the authorities’ tone. In its July MPC minutes, the PBoC used the phrase “structural divergence” for the first time. Hong Kong’s SCMP read it as an official admission of an internal gap — AI, high-tech, and exports firm, while consumption and private investment lag. The line “supply is strong and demand is weak” appeared directly.
Goldman Sachs called it “a sign the PBoC acknowledges weakening growth momentum.” Markets widely expect additional stimulus (rate cuts, consumption vouchers, extended appliance subsidies) after the late-July Politburo meeting. But because past support largely pulled demand forward, doubts about its durability are rising too.
East Asia backdrop — the July 24 tariff clock
Exports have propped up weak demand — but a tariff time bomb is ticking. The US “global 10% tariff” (Trade Act Sec. 122) expires July 24, and Washington is moving to replacement tariffs under Section 301. The Trump administration has even threatened 100%+ duties on Chinese goods.
So much of the recent export surge (automatic data-processing units +60%) is “front-loading” — orders pulled forward to beat tariffs, with US importers advancing Black Friday and Christmas volumes by 4–6 weeks. Once tariffs bite, that front-loading can reverse. The US has also opened anti-dumping probes into Chinese transshipment via Mexico, spreading supply-chain verification risk to Korean firms that use Chinese intermediates.
So where to invest — a China ETF map
In a K-shaped economy, the question isn’t “buy China” but “buy which China.” Sector and stock selection matter more than the index direction. Here are three flagship ETFs sorted by profile.
① Growth, high-vol — KWEB (KraneShares CSI China Internet): concentrated in internet/tech like Alibaba and Tencent. Explosive in rallies but vulnerable to regulation and tariffs — down ~29% YTD (as of 6/30). Korea-listed TIGER/KODEX China HangSeng Tech share this profile.
② Broad — MCHI (iShares MSCI China) and CSI300: diversified across financials, energy, consumer, and healthcare, so the drawdown is cushioned at ~-7% YTD. Use it as a core for long-term “whole China” exposure. ③ Defensive, dividend — FXI (iShares China Large-Cap): SOE financials and energy, lower volatility, ~2.3% yield. If equity volatility itself is the problem, some investors turn to EM USD bonds like EMB (5.4% yield).
China ETF map — different animals
CompareGrowth, high-vol (KWEB)
Broad (MCHI/CSI300)
Defensive, dividend (FXI)
China ETF KWEB MCHI FXI comparison. Same ‘China’, very different risk depending on holdings. YTD as of 2026-06-30 (KWEB official). A taxonomy, not advice.
Bottom line: domestic-consumption names likely stay weak until stimulus is confirmed, while export/tech names may swing around the July 24 tariff event. In practice, many advisors treat China ETFs as a 5–10% satellite, not a core, and add in tranches only once easing is confirmed. Again: this is a taxonomy, not investment advice.
Checkpoints for Korean investors & firms
① Mid-July Q2 GDP — consensus 4.5–4.7%, slower than Q1’s 5.0%. ② Late-July Politburo — the strength of stimulus and any consumption vouchers steer consumer names. ③ July 24 tariff shift — a volatility event for export/tech. ④ Korea’s heavy reliance on Chinese intermediates means checking transshipment and origin-verification risk. Korean plays tied to Chinese consumption (cosmetics, duty-free, travel) warrant caution until stimulus is confirmed.
Wrap-up
China today is a country where the factories run but the wallets are shut. Exports and AI manufacturing defend the headline numbers, but the demand-side illness — negative retail sales, property slump, margin squeeze — won’t heal easily without stimulus. Now that the PBoC has admitted “structural divergence,” the strength of stimulus and the July 24 tariffs will set the temperature of the two Chinas.
One line. Don’t ask whether China is “good or bad” — ask “which China.” Whether you look at the top or the bottom of the K decides which ETF belongs in your basket.
Don’t ask whether China is good or bad — ask which China. The top and bottom of the K need different baskets.
Sources
- MoneyToday — PBoC structural divergence
- China NBS — June CPI
- Global Economic — K-shape deep dive
- Yonhap — May retail sales -0.6%
- MoneyToday — retail & property
- Financial News — Q2 GDP outlook
- Yonhap — US tariff transition
- Global Economic — transshipment probes
- KraneShares — KWEB official
- Yahoo Finance — 3 China ETFs
- Internal: 2026-07-12-china-k-divergence-session-01.md
중국 내수는 왜 안 살아나나 — K자 경제와 투자 지도 (조회수 3)
“요즘 중국 내수가 약하다”는 말, 뉴스에서 자주 들리시죠. 그런데 이상합니다. 같은 시기 중국 수출은 전년 대비 +19.4%, 공장 가동을 보여주는 산업생산은 +4.5%로 멀쩡합니다. 공장은 잘 도는데 왜 ‘경제가 어렵다’고 할까요? 답은 ‘두 개의 중국’에 있습니다.
위쪽 중국(수출·AI·첨단제조)은 뜨겁고, 아래쪽 중국(소비·부동산·고용)은 차갑습니다. 알파벳 K처럼 위아래가 갈라지는 이 구조를 시장은 ‘K자 경제’라 부릅니다. 이 글에서는 ① 지표로 본 분화, ② 내수가 왜 안 사는지, ③ 인민은행·관세 등 동아시아 정세, ④ 관련 중국 ETF 지도까지 풀어 씁니다. 투자 권유가 아닙니다.
숫자로 본 두 개의 중국
두 개의 중국 전년비 (%)
세로 막대 그래프중국 수출 산업생산 PPI CPI 소매판매 전년비 비교. 수출·산업생산·PPI는 견조하지만 CPI는 1%, 소매판매는 마이너스. 같은 나라 안에서 위·아래가 갈라지는 ‘K자’입니다. (수출·산업생산·소매판매 5월, CPI·PPI 6월 기준)
가장 선명한 대비는 물가에서 나옵니다. 6월 생산자물가(PPI)는 AI 장비·산업용 로봇 수요로 +4.1%, 4개월 연속 올랐습니다. 반면 소비자가 체감하는 소비자물가(CPI)는 +1.0%에 그쳤고 예상치(1.1%)도 밑돌았습니다. 공장 문 앞은 뜨거운데, 소비자 물가는 미지근한 겁니다. 여기에 5월 소매판매가 -0.6% — 코로나 봉쇄를 푼 2022년 말 이후 3년 반 만의 첫 감소였습니다.
아래 그래프가 이 분화를 한눈에 보여줍니다. 수출·생산·생산자물가는 우뚝하지만, 소비자물가는 낮고 소매판매는 아예 마이너스입니다. 같은 나라 안에서 성장의 위·아래가 갈라진 K자입니다.
왜 안 사나 — 내수 악순환
핵심 원인은 부동산입니다. 1~5월 부동산 개발투자가 -16.2%로 5년째 침체이고, 5월 선전 신규주택 가격은 전년비 -4.5%까지 빠졌습니다. 집값이 5년째 내리면 가계는 ‘내 자산이 줄고 있다’고 느끼고, 고용·소득 불안까지 겹치면 지갑을 닫고 저축을 늘립니다. 실제로 이구환신(보상판매) 혜택을 받던 가전(-15.6%)·자동차(-16.1%) 소비가 무너졌습니다 — 정책으로 미리 당겨 쓴 수요의 반작용입니다.
소비가 얼면 기업은 원가가 올라도 판매가를 못 올립니다. 중동발 에너지 불안으로 원자재값은 뛰는데(PPI +4.1%), 소비자에게 전가를 못 하니(CPI +1.0%) ‘많이 팔수록 덜 버는’ 마진 압박에 빠집니다. 차이신 산출가격지수는 48.2, 고용지수는 48.5로 둘 다 위축권입니다. 결국 기업이 고용·투자를 줄이고(제조업 투자 -0.4%, 민간투자 -7.1%), 그게 다시 소득 불안으로 돌아오는 악순환입니다.
내수는 왜 — 악순환
흐름도중국 내수 부진 악순환 흐름도. 부동산이 5년째 빠지니 자산·심리가 위축되고, 가계가 지갑을 닫자 기업은 가격을 못 올려 고용·투자를 줄입니다. 그게 다시 소득 불안으로 돌아옵니다.
인민은행도 인정한 ‘구조적 분화’
주목할 변화는 정책 당국의 태도입니다. 7월 통화정책위원회 회의록에서 인민은행은 처음으로 ‘구조적 분화(structural divergence)’라는 표현을 썼습니다. 홍콩 SCMP는 이를 ‘AI·첨단제조·수출은 견조한데 내수 소비·민간투자는 부진하다’는 내부 격차를 공식 인정한 것으로 해석했습니다. “공급은 강하고 수요는 약하다”는 문장도 직접 들어갔습니다.
골드만삭스는 “성장 모멘텀 약화를 인민은행이 인정한 신호”라고 평가했습니다. 시장에서는 7월 말 정치국 회의 이후 소비 안정용 추가 부양책(금리 인하·소비 쿠폰·가전 보조금 연장 등)이 나올 것이란 기대가 큽니다. 다만 지금까지의 부양은 ‘수요를 당겨 쓰는’ 성격이 강해, 지속력에 대한 의구심도 함께 커지고 있습니다.
동아시아 정세 — 7월 24일 관세 시계
내수 부진을 그동안 떠받친 건 수출인데, 여기에 관세 시한폭탄이 걸려 있습니다. 미국의 ‘글로벌 10% 관세’(무역법 122조)가 7월 24일 만료되고, 미국은 무역법 301조 기반의 대체 관세로 갈아타는 절차를 밟고 있습니다. 트럼프 행정부는 중국산에 100% 이상 관세도 위협하고 있습니다.
그래서 최근 중국 수출 급증(자동데이터처리장치 +60%)의 상당 부분은 관세를 피하려 미리 당긴 ‘선주문(front-loading)’입니다. 미국 수입업자들이 블랙프라이데이·크리스마스 물량까지 4~6주 앞당겨 주문한 겁니다. 관세가 현실화되면 이 선주문 효과는 반작용으로 돌아올 수 있습니다. 미국은 또 중국산의 멕시코 등 제3국 우회수출에 반덤핑 조사를 시작해, 중국 중간재를 쓰는 한국 기업의 공급망 검증 리스크까지 번지고 있습니다.
그럼 어디에 투자하나 — 중국 ETF 지도
K자 경제에서는 ‘중국을 산다’가 아니라 ‘중국의 무엇을 사느냐’가 핵심입니다. 지수 방향보다 섹터·종목 선택이 수익률을 가릅니다. 대표 ETF 세 가지를 성격으로 나눠 보겠습니다.
① 성장·고변동 — KWEB(KraneShares CSI China Internet). 알리바바·텐센트 등 인터넷·테크에 집중합니다. 상승장에선 폭발적이지만, 규제·관세에 취약해 YTD 약 -29%(6/30 기준)로 낙폭도 큽니다. 국내 상장으론 TIGER·KODEX 차이나항셍테크가 비슷한 성격입니다.
② 종합형 — MCHI(iShares MSCI China)·CSI300. 금융·에너지·소비·헬스케어까지 전 섹터에 분산돼 YTD 약 -7%로 낙폭이 완충됩니다. ‘중국 전체’에 장기 노출하고 싶을 때 코어로 씁니다. ③ 방어·배당 — FXI(iShares China Large-Cap)는 금융·에너지 국유기업 중심으로 변동성이 낮고 배당 약 2.3%를 줍니다. 주식 변동성 자체가 부담이면 EMB 같은 신흥국 달러채(수익률 5.4%)로 눈을 돌리는 투자자도 있습니다.
중국 ETF 지도 — 성격이 다르다
개념 비교성장·고변동 (KWEB)
종합 (MCHI/CSI300)
방어·배당 (FXI)
중국 ETF KWEB MCHI FXI 성격 비교. 같은 ‘중국’이라도 무엇을 담느냐에 따라 위험·성격이 완전히 다릅니다. YTD 수치는 2026-06-30 기준(KWEB 공식). 투자 권유가 아니라 성격 분류입니다.
정리하면, 내수 소비주는 부양책이 확인되기 전까지 약세 가능성이 크고, 수출·테크주는 7/24 관세 이벤트를 전후로 변동성이 커질 수 있습니다. 그래서 실전에서는 중국 ETF를 포트폴리오의 핵심이 아니라 5~10% 위성 자산으로 두고, 정책 완화가 확인될 때 분할로 접근하라는 조언이 많습니다. 다시 강조하지만 투자 권유가 아니라 성격 분류입니다.
한국 투자자·기업 체크포인트
① 7월 중순 2분기 GDP 발표 — 컨센서스는 4.5~4.7%로 1분기(5.0%)보다 둔화 전망. ② 7월 말 정치국 회의 — 부양책 강도·소비 쿠폰 여부가 소비주의 방향타. ③ 7월 24일 관세 전환 — 수출·테크주 변동성 이벤트. ④ 한국은 중국 중간재 의존도가 높아 우회수출·원산지 검증 리스크를 확인해야 합니다. 화장품·면세·여행 등 중국 소비 관련 한국주는 부양책 확인 전까지는 신중할 필요가 있습니다.
정리
중국은 지금 공장은 도는데 지갑은 닫힌 나라입니다. 수출·AI 제조가 지표를 방어하지만, 소매판매 마이너스·부동산 침체·마진 압박이라는 내수의 병은 부양책 없이는 잘 낫지 않습니다. 인민은행이 ‘구조적 분화’를 인정한 만큼, 앞으로는 부양책의 강도와 7/24 관세가 두 갈래 중국의 온도를 가를 겁니다.
한줄 정리. ‘중국이 좋다/나쁘다’가 아니라 ‘어느 쪽 중국이냐’를 먼저 물어야 합니다. K자의 위를 볼지 아래를 볼지에 따라, 담아야 할 ETF도 완전히 달라집니다.
‘중국이 좋다/나쁘다’가 아니라 ‘어느 쪽 중국이냐’를 먼저 물어야 한다. K자의 위와 아래는 담아야 할 바구니가 다르다.
출처
- MoneyToday — PBoC structural divergence
- China NBS — June CPI
- Global Economic — K-shape deep dive
- Yonhap — May retail sales -0.6%
- MoneyToday — retail & property
- Financial News — Q2 GDP outlook
- Yonhap — US tariff transition
- Global Economic — transshipment probes
- KraneShares — KWEB official
- Yahoo Finance — 3 China ETFs
- Internal: 2026-07-12-china-k-divergence-session-01.md
답글 남기기