Canada Internal Trade Barriers — A 6.8% GDP Opportunity, Uneven Profits
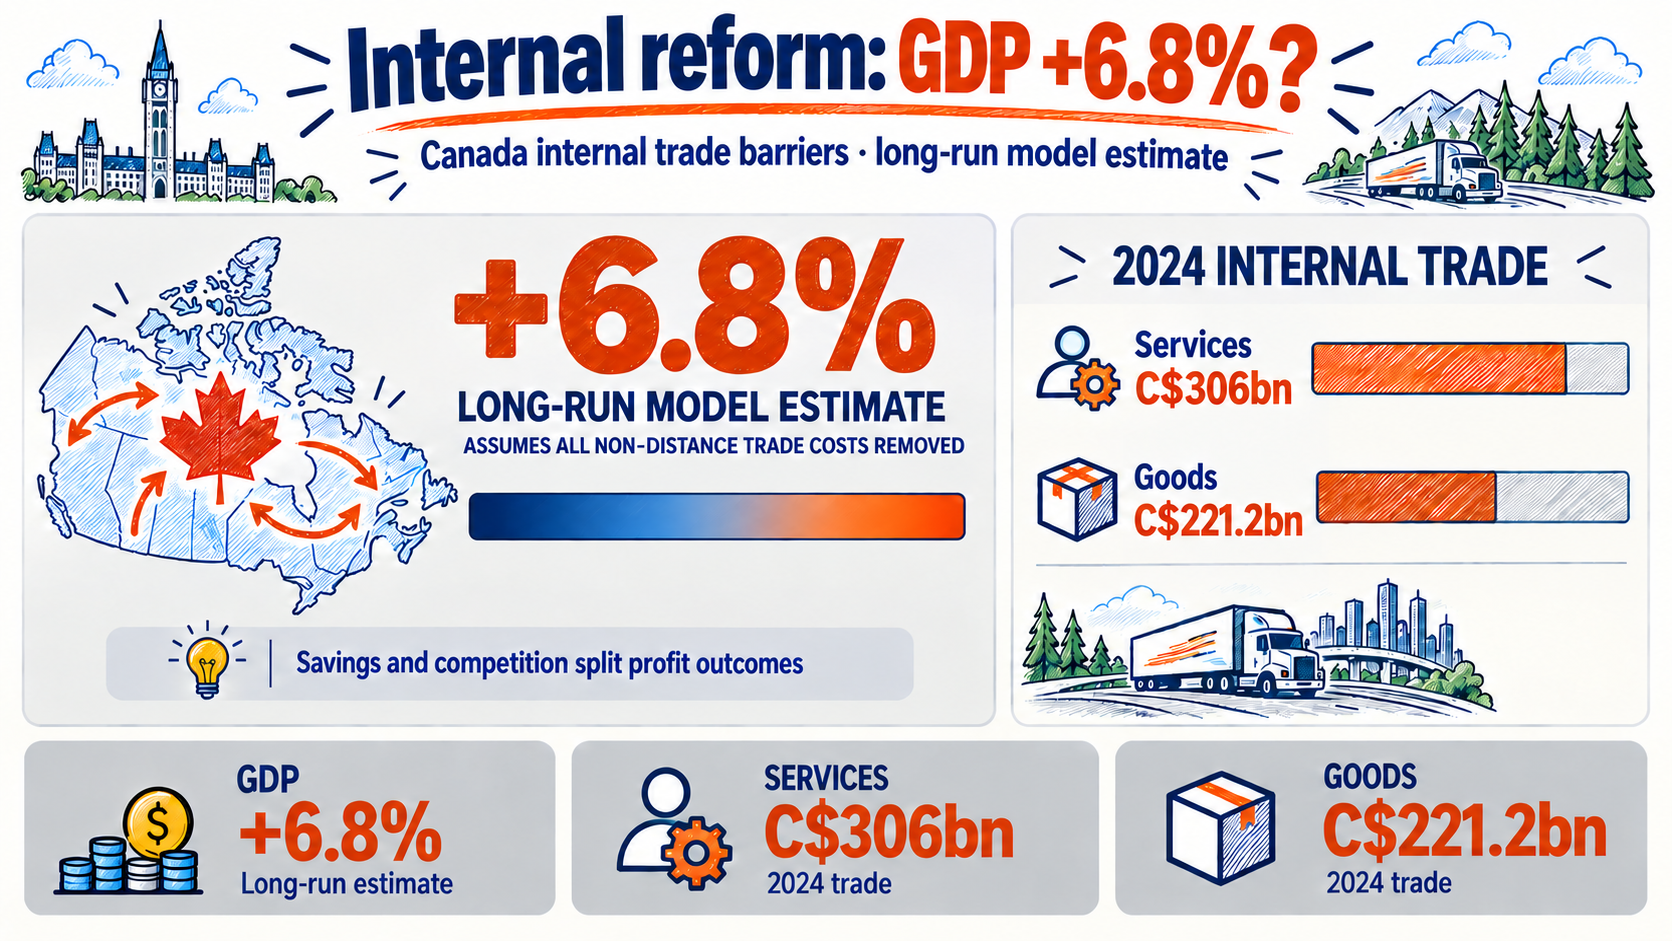
Canada internal trade barriers could have a substantial economic cost. An IMF paper released on September 18 estimates that removing all non-distance trade costs would lift long-run real GDP by 6.8% relative to its baseline. Certification costs, selling prices and local operations help explain why companies would benefit unevenly. IMF paper
This is about selling to customers and hiring workers elsewhere in the same country. While international tariffs attract attention, the cost of reaching domestic customers can also change an investment decision. A national market on a map does not necessarily function as one market for a business.
Canada internal trade barriers do not require a tariff
Canada does not levy tariffs between provinces. Different standards, licences and paperwork can still impede trade. The mutual recognition agreement for goods excludes food and retains listed exceptions. Permission to sell in one location does not guarantee unrestricted sales everywhere. Government explanation
Imagine an equipment supplier extending its sales network into another region. An additional compliance review delays the launch, while staff and inventory still need funding. A later date for the first sale makes expansion less attractive. This is an illustrative business example, not a reported company case.
A small supplier has fewer orders over which to spread the same administrative expense. Simplification can therefore make expansion viable before the firm builds a new factory. The immediate change is a larger reachable customer base; additional production capacity becomes a later decision.
The 6.8% estimate is not next year’s growth rate
This is a long-run difference in GDP levels. Table 8 reports 4.2%, a baseline 6.8%, and 8.8% under different assumptions about trade responsiveness. These are sensitivity calculations, not probabilities or a confidence interval. Table 8, printed page 28
Long-run GDP gains vary with assumptions. IMF Table 8. Full removal of non-distance costs. High responsiveness: 4.2%; baseline: 6.8%; low responsiveness: 8.8%. Not annual growth or a confidence interval.
It would be a mistake to put this percentage into a company’s next-year revenue forecast. Finding customers, recruiting workers and adapting facilities take time. Competition also stands between additional output across the economy and the sales captured by a particular firm.
Nor should every cost unrelated to distance be treated as a needless legal restriction. Local demand and business practices can differ too. Complete removal is a useful analytical benchmark, but a business still needs to identify the specific expenses that a feasible reform would eliminate.
Services cross provincial borders—and enter manufacturing costs
Statistics Canada’s September 2 release puts 2024 interprovincial trade at approximately C$527 billion: C$306 billion in services and C$221.2 billion in goods. Services account for about 58%. The data concern 2024, and the headline total is rounded. Statistics Canada, pages 7–8
Services exceed goods in interprovincial trade. Statistics Canada, released September 2, 2026. Nominal 2024 flows: services 306, goods 221.2. Headline total of about 527 is rounded.
A factory buys services as well as materials. Equipment design, transport, inventory management and financing all enter its cost base. Better purchasing terms for those services can change total production costs without changing the product itself.
Consumers benefit if savings reach retail prices, allowing the same income to buy more. But a lower supplier bill does not automatically mean a lower shelf price. How much is passed on depends on competition and on the alternatives available to customers.
Lower costs and more reachable customers can unlock investment
The following is our economic interpretation. Fewer repeated compliance steps reduce the initial cash needed to enter a region. Additional customers can then improve utilisation of existing equipment. Sustained orders, rather than regulatory announcements alone, make additional capacity worth considering.
-
1
Lower entry cost
Less repeated compliance work
-
2
Wider customer reach
Additional customer contracts
-
3
Use existing capacity
Sustained orders lift utilisation
-
4
Consider investment
Profitability and finance are required
The sequence matters. Spare capacity may absorb new orders through longer operating hours, with no immediate factory expansion. And if customers pay slowly, the first additional financing requirement may be working capital—the cash tied up in everyday operations—rather than machinery.
Employment can move unevenly across locations. Expanding businesses may recruit while firms losing customers reduce hiring. Even when qualified workers are permitted to move, housing costs and family constraints can slow actual relocation. Administrative permission and practical adjustment operate on different timelines.
A more efficient economy can still put some profits under pressure
Some companies could lose profit even as costs fall. A business previously sheltered from outside competitors may have to lower prices once entry becomes easier. If selling prices decline more than costs, its margin contracts.
A competitive supplier previously deterred by expansion costs has a different opportunity. Serving more customers with the same management team can reduce fixed costs per sale. That does not mean every small firm wins: an established national operator may be better equipped to expand first.
A competitive entrant
More markets for existing products
Opportunity
Profit condition · Incremental profit exceeds expansion cost
Risk · Launch costs and price competition
A sheltered incumbent
Better access to outside suppliers
Opportunity
Profit condition · Savings exceed pressure on selling prices
Risk · Entry erodes established margins
Revenue growth alone is weak evidence of success. More useful questions concern the compliance, sales and servicing expenses needed to win that revenue, and whether margins survived price competition. A network built through acquisitions also needs to earn back its purchase and integration costs.
For Korean firms, entering Canada and serving it nationally are different tasks
The federal Free Trade and Labour Mobility in Canada Act and its regulations took effect on January 1, 2026. They recognise comparable provincial requirements for federal purposes; they do not remove provincial or territorial requirements themselves. Official guide to the Act
Exporting from Korea and providing distribution, installation and repairs across Canada are separate business tasks. An internal trade reform does not by itself remove import procedures or product-specific obligations. This article does not determine whether a particular Korean product qualifies for any exemption.
The commercial analysis starts with the local partner agreement. Does the distributor cover one region or several? Can its staff service the additional customers? Who pays for additional procedures and delays? If the distributor retains all savings, the Korean manufacturer may capture little extra profit.
For a manufacturer operating locally, more choice among component and maintenance suppliers could lower operating costs. Qualifying new suppliers and maintaining quality also carry expenses. These are conditional implications for Korean businesses, not evidence of announced contract wins.
For markets, follow the operating evidence after the announcement
Equities can price reform expectations before operating results arrive. Eventually, cash flow must support those expectations. Even a company pursuing national expansion can face a slower earnings improvement if launch expenses rise or competition forces price cuts.
The paper alone also cannot establish a currency or bond-market direction. More efficient production can relieve cost pressure while additional investment increases financing demand. External demand and monetary policy matter too. An internal-market reform is insufficient evidence for a simple currency-appreciation or falling-yield forecast.
The useful follow-up is to connect fewer repeated procedures with additional sales across regions, then establish whether savings reached consumers or stayed in company earnings. Historical trade data provide a starting point for comparison, not proof that current reforms have already succeeded.
The broader question is relevant to Korea: does business expansion need another subsidy, or could it benefit from lower costs of reaching customers and buying services? Canada’s estimate cannot be transferred to Korean GDP. This article explains economic mechanisms and does not recommend buying or selling any asset.
Judge market expansion by the cost of reaching new customers and the profit left after competition.
Sources
For information only — this is not a recommendation to buy or sell any asset.
Comments 0