Container Freight Rates at $11,259: The Profit Squeeze for Korean Exporters
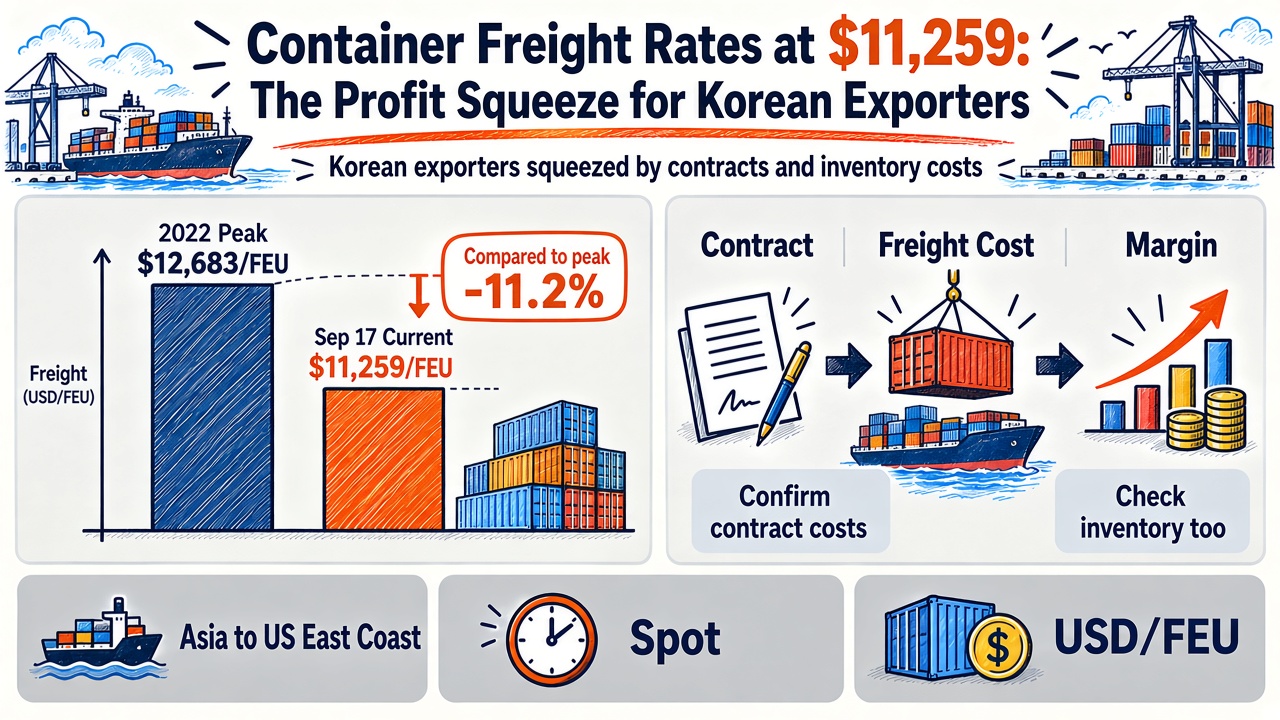
Container freight rates are changing exporters’ profit calculations again. Xeneta’s September 18 update puts Far East–US East Coast spot freight at $11,259 per 40-foot container. Who pays the bill, and who can recover it in product prices, determines the impact on Korean companies. Xeneta data
Imagine an exporter that has agreed a selling price, only to discover that shipping will cost much more than budgeted. Unless it can renegotiate, the extra expense comes out of profit. If delivery also takes longer, cash needed for the next order may arrive later.
The information cutoff is September 19, 2026. Reported data, analyst forecasts and hypothetical calculations are identified separately. The Korean business implications are conditional analysis, not company earnings forecasts or investment recommendations.
What the $11,259 container freight rate measures
A spot rate is the price for newly booked transport, distinct from rates negotiated under longer-term agreements. FEU means one 40-foot container. Dollar quotations are comparable only when the equipment, route and included services are comparable.
The observation date is September 17. The East Coast average is 324.7% above February 28, but 11.2% below its comparable 2022 peak of $12,683. It has not set a record. Dates and comparison
Container Freight Rates: $12,683 peak versus $11,259 in September 2026. Xeneta Far East–US East Coast spot series. Peak: Jan 1, 2022; current: Sep 17, 2026. Not a contract rate or individual Korean quote. · Axis starts at 10,000, not zero
Reuters reported $10,948 for China–US East Coast freight. That origin scope differs from the Far East average; the precise sample and timing differences were not independently reconciled. Our chart therefore uses only Xeneta’s Far East series. It is not a quotation for every shipment leaving Korea. Reuters report
Fuel costs matter, but so does vessel turnaround
Freight prices reflect both operating costs and the availability of space on a particular departure. A ship stuck outside a port begins its next voyage later. The fleet can be unchanged while the number of containers it can move each month falls.
For illustration, suppose a round trip stretches from 40 days to 50. With capacity and other conditions unchanged, transport capacity per day falls to 40/50, or 80% of its previous level. This is a hypothetical example, not a measured route statistic. It explains why congestion can strengthen carriers’ pricing power.
Freightos reported a 2% weekly rise to the US East Coast, against declines of 3% to Northern Europe and 12% to the Mediterranean. It suggests partial Red Sea returns and easing post-peak demand helped European routes. This independently supports diverging route directions, not Xeneta’s exact price level. Freightos weekly analysis
A higher freight rate alone is not proof of stronger global consumption. Prices driven by more orders tell a different economic story from prices driven by slower, more expensive transport. Cargo volumes and on-time performance are needed to distinguish the two.
A long-term contract does not always fix the final bill
The contract matters because a fixed base rate may coexist with a fuel adjustment. A fuel surcharge passes through specified fuel-related costs. Applying a headline spot-rate increase to a company’s entire freight budget can therefore badly misstate its exposure.
Maersk’s public general terms provide for fuel-related price adjustments, including exceptional circumstances such as war or route disruption. A separate signed agreement can prevail where inconsistent. These terms do not describe every carrier’s contracts, but illustrate why a long-term agreement need not freeze the final invoice. Maersk contract terms
A March Maersk advisory also explained an emergency surcharge for fuel availability, cost and mix beyond its ordinary fuel fee. That historical notice supports the mechanism; its amounts are not presented as current September tariffs. Emergency surcharge notice
For a Korean exporter, the first questions are who pays freight, how much is booked spot, when fuel adjustments reset and whether customers accept repricing. Buyer-paid freight may protect current costs. It does not prevent the buyer from demanding a lower product price on the next order.
How an extra $6,259 can change an order’s profit
Consider an illustrative shipment, not a company forecast: revenue of $100,000 and costs excluding freight of $85,000. Assume the seller pays all freight and budgets $5,000 for it. Profit is then $10,000.
Replacing that budget with $11,259 leaves $3,741. Holding selling prices and other costs constant, profit falls 62.6%, and the margin drops from 10% to about 3.7%. The $5,000 starting point is an assumption, not a historical freight observation.
-
1
Sales $100,000
Other costs $85,000
-
2
Freight $5,000
Budget profit $10,000
-
3
Freight $11,259
Extra cost $6,259
-
4
Profit $3,741
Margin about 3.7%
The value of the goods inside the container changes the result. High sales value per unit of space dilutes freight costs; bulky, lower-value products carry more exposure. Furniture, household goods and some appliances shipped in containers deserve closer freight scrutiny. This does not imply that all products use the same transport mode.
A company with pricing power can pass some of the bill to customers. Under intense competition, it may instead cut promotions, redesign packaging or stop selling low-margin products. Consumers can face a higher effective price even if the sticker price is unchanged. These are transmission channels, not observed consumer outcomes.
The next pressure is inventory and working capital
Unreliable delivery can encourage earlier orders and larger safety stocks. Inventory is money committed to goods that have not yet turned back into cash. A company pays for materials and labor before receiving customer payments; financing that gap is working capital.
Suppose daily costs are KRW 1 million and the transit-to-payment period lengthens by ten days. The simplified additional funding requirement is KRW 10 million. If financed entirely at an assumed 6% annual rate and maintained, that implies KRW 600,000 of annualized interest. These are illustrative assumptions.
Falling freight rates do not immediately remove expensive inventory already on hand. Weak sales can force markdowns. Investors should compare inventories, collection periods for unpaid customer invoices, and operating cash flow with the freight chart. Accounting earnings and cash recovery can improve at different times.
Larger balance sheets can support multiple transport contracts or local warehousing. Smaller suppliers may have to decline orders if they cannot finance both freight and inventory. If disruption persists, procurement capability and access to cash can influence market share, beyond differences in manufacturing cost.
Local production becomes worth evaluating, but is not automatically cheaper. Freight savings must cover plant costs, local wages and the risk of underused capacity. Management needs to distinguish temporary rates from persistent costs. Extra working capital can also crowd out the cash that would otherwise fund new equipment.
For shipping shares, durability matters more than today’s quote
Carriers collect higher freight revenue but also pay for fuel, chartered ships and delays. Profit depends on the spread between realized revenue and cost, the contract mix and vessel utilization. A percentage increase in spot prices is not an equivalent percentage increase in operating profit.
Xeneta reports 6–7% more offered East Coast capacity in September than August. Its analyst expects a possible slowdown or softening after an early-October push. That is a forecast, not an established price path. Capacity and outlook
My reading is that exporters need pricing power, while carriers need favorable rates to last. Shipping shares can reflect anticipated declines before current earnings deteriorate. Exporters also need healthy orders and recovering margins; cheaper transport alone does not guarantee better equity returns.
The macro outlook has two distinct paths. Lower rates caused by restored capacity can ease costs and support consumption and investment. Lower rates caused by collapsing orders leave companies with a demand problem. The reason for the move matters as much as its direction.
In the coming weeks, watch consistent route-level spot data, offered capacity, schedule reliability and companies’ freight obligations together. In earnings releases, inventory and cash collection deserve attention alongside revenue. Identify who paid the higher bill and when they can recover the cash.
For related context, see oil costs and the Korean economy and Chinese exports and Korean companies’ pricing competition.
Who pays freight, and when the cash returns, determines the business impact.
Sources
- Xeneta — Weekly Ocean Container Shipping Market Update, 18 September 2026
- Reuters — Ocean container shipping rates could test record highs, 17 September 2026 (MarketScreener 전재)
- Freightos — Red Sea transits accelerate, 15 September 2026 (updated 17 September)
- Maersk — Ocean Contract Product General Terms and Conditions (21 July 2026 amendment)
- Maersk — Introduction of temporary Emergency Bunker Surcharge (18 March 2026 update)
For information only — this is not a recommendation to buy or sell any asset.
Comments 0