Korea Solo Entrepreneurship: 1.16M Businesses, Avg 266M KRW — Paths to 10 Billion
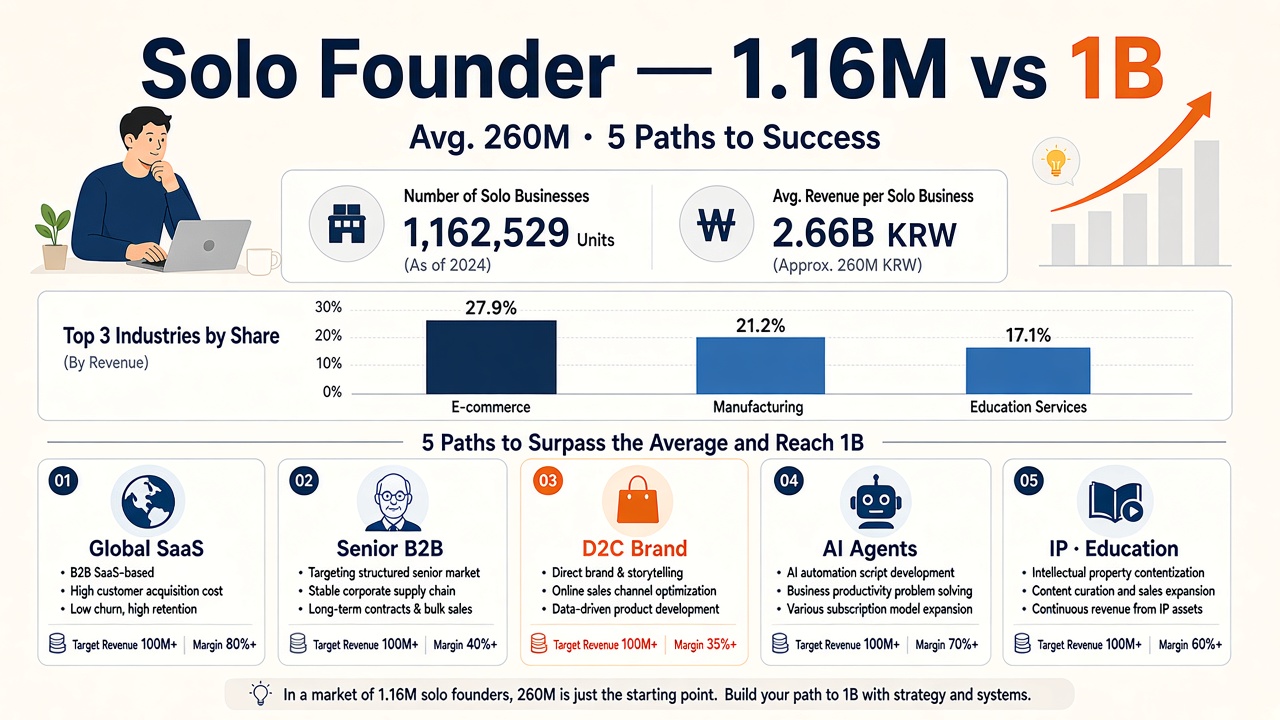
Korea’s solo entrepreneurship layer — solo creative enterprises in MSS terms — hit 1,162,529 in 2023, up 15.4% YoY. Headlines scream a boom.
The same survey puts average revenue at about 266 million KRW (~2.66억) and net profit at ~36 million KRW. For one owner with no paid staff, that is often above a side hustle, below a big-company salary after tax and costs.
Today we narrow the lens: Korea’s 1-person reality, how the US, UK, Germany, and Japan differ, and which fields and models could plausibly approach 10 billion KRW (100억) in sales — in five story-like scenarios.
Analogy: 1.16 million runners in one race; the average finish is ~266 million KRW; 10 billion KRW is Olympic territory. Same sport, different course and shoes.
Not business, tax, or investment advice. Commentary based on official stats and public cases.
Korea solo entrepreneurship — what the numbers say
MSS defines solo creative enterprises as one person (or up to four partners) with no regular employees. Some sectors are excluded.
Industries: e-commerce 27.9%, manufacturing 21.2%, education services 17.1%. Customers: B2C 78%, B2B 19.1%. Average founder age 55.1; 16.3 years prior work experience.
First sale in 2.6 months; break-even in 29.8 months. Survival is not scale.
Solo industry mix — chart
Korea solo enterprise industry mix e-commerce manufacturing education. 2023 solo creative enterprise industry share (%). MSS 2025 survey. Not advice.
How advanced economies differ
Share: Korea’s self-employment rate is 23.2% of employment vs 6.1% US, 8.6% Germany, 9.5% Japan (Destatis, 2023).
Scale: UK businesses with no employees average ~£89,889 turnover (2024). Thick “small revenue” layer in both countries.
Ceiling: US nonemployers are the majority of establishments; ~$1.8T receipts in 2023 (Census). Global rails — Stripe, app stores, Upwork — help a thin tail scale in dollars.
Korea: many solo operators; US/UK: lower share, higher platform ceiling for digital.
Self-employment rate — country chart
Korea US Germany Japan self-employment rate comparison. Self-employment % of employment, 2023. Destatis intl table. Structural compare only.
What works in Korea — fields and models
Patterns for scale: sell units not hours; don’t trap in Korea-only B2C; package 10+ years of career; leverage AI/outsourcing while staying the sole decision-maker.
Harder combos: pure marketplace 3P price wars, hourly freelancing only, offline high-fixed-cost alone — tend to stick near the 2.6bn average.
10bn KRW sales — five scenarios
Ten billion KRW annual revenue is a extreme tail among 1.16M firms. Five what-if stories — not forecasts.
① “3 a.m. deploy” — global B2B micro-SaaS
Seoul solo dev; $49/mo niche tool; AI support; ~$700k MRR year three → ~10bn KRW annualized. <5% Korea customers. Risk: FX, tax, clones.
② “The retired manager’s second title” — senior B2B packages
18 years in equipment sales; 300M KRW/yr retainers × 40 SMEs → 12bn KRW revenue, 35% margin. Matches Korea’s 55-year-old founder profile.
③ “Warehouse-free shop” — D2C + OEM
Skincare brand; OEM/3PL; founder-led live commerce; 11bn KRW sales, zero regular staff, heavy ad/logistics spend.
④ “Agent factory” — SME subscription automation
9.9M KRW/mo × 900 clients → ~10.6bn KRW; one human, dozens of AI agents.
⑤ “When the newsletter became the company” — IP + training
120k free subs; 8k paid; 150 corporate workshops → ~10bn KRW. Trust is the product; regulation is the risk.
Common thread: copy, subscription, packages, global pricing — not selling hours in KRW.
10bn paths — feasibility chart
Solo entrepreneurship 10bn KRW path feasibility index. Relative feasibility index toward ~10bn KRW for solo operators in Korea (100=best). Author judgment.
Revenue ladder — average to 10bn
Solo business revenue ladder avg 2.6bn to 10bn KRW. Revenue scale (100M KRW units). Avg from MSS; 10bn is scenario ceiling. Not advice.
Reality check — odds and policy
Relative odds: global SaaS highest ceiling but hardest entry; senior B2B best fit for Korea’s age/career stats; AI agents fast but commoditized; D2C margin traps; IP/edu regulatory cliff.
Programs like TIPS often assume 2+ person teams — solo tech founders start behind (Korean press). Ladder: avg 2.6bn → top ~10bn → rare 30bn → scenario 100bn.
Investor lens — funding solo founders & returns
From the investor side, not every solo operator is an asset. MSS’s 1.16M count mixes livelihood businesses (~266M KRW avg revenue) with a thin tail that shows growth curves, cap tables, and exit paths.
① Personal investment associations (angel funds) — 1,248 new registrations in 2024 (Korean press). Up to 100% income deduction on the first 30M KRW of venture investment. Liquidated venture funds averaged ~10% returns (2021–23, MSS-cited); top funds hit ~32% gross IRR (e.g. Woowa/Toss-era vintage). GPs often cite ~20% target IRR — a target, not a population average.
② Direct angel / syndicates — US Kauffman/ACA-style studies: diversified angel books often discuss 2.5–2.6x MOIC, ~22–27% IRR, but 50–70% of deals return less than capital; a few 5–30x winners carry portfolios (power law). Median IRR near 0% with only 1–5 names is common in the data.
③ Revenue-based financing (RBF) — repay via a % of revenue to a 1.2–3x cap, usually non-dilutive for founders. Funds often target 15–30% IRR with quicker distributions than equity. Fits recurring revenue / margin — closer to global SaaS scenarios than the 2.6bn KRW average shop.
④ Equity crowdfunding — from ~1M KRW on Korean platforms. Marketing decks cite 15–25% IRR on equity deals; bond-style crowdfunding history shows ~10.5% on winners vs ~64% loss rates on losers (Bizwatch 2019) — same hit-driven math as angels.
⑤ Debt / policy loans — founder financing, not investor return products. The most common rail for solo operators.
Bottom line for investors: capital attaches where copy, subscription, and global pricing show up — the same models that might reach 10bn KRW. The question is how many names out of 1.16M, not the headline IRR on a slide.
Investment channels — expected return chart
Investor return bands for solo-founder channels venture angel RBF. Approx. annual IRR (%). Mix of liquidated VC stats, angel studies, RBF targets. Not advice.
Checklist
Hours vs units; B2C trap; career package; global payment rails; leverage without employees; is the goal 3–5× average or 100bn?
Wrap-up
Solo entrepreneurship in Korea is huge in count, modest in average scale. 10bn KRW lives in a few repeatable story types — global SaaS, packaged expertise, leveraged D2C, agent subscriptions, IP.
For investors, angel, personal funds, RBF, and crowdfunding draw different risk-return curves — ~10% liquidated VC averages vs ~25% diversified angel targets vs 30%+ top-quartile funds, all before diversification and tax.
One line. Founders choose between the 2.6bn and 10bn courses; investors choose which few names in 1.16M deserve capital.
Solo entrepreneurship is a headcount game only at the start — then it is a course-selection game.
Sources
- Yonhap — MSS solo enterprise survey 2025
- KDI — MSS survey summary
- Destatis — self-employment international
- UK — Business Population Estimates 2024
- US Census — nonemployer statistics 2023
- MoneyToday — Korea solopreneur vs US
- MoneyToday — angel investing & tax deduction
- Chosun — personal investment associations
- Koor — angel portfolio IRR studies
- Internal study: 2026-06-17-korea-solo-entrepreneur-100bn-session-01.md
For information only — this is not a recommendation to buy or sell any asset.
Comments 0