Semiconductor Selloff Jul 7 — Korea & US Drop, Bottleneck Odds
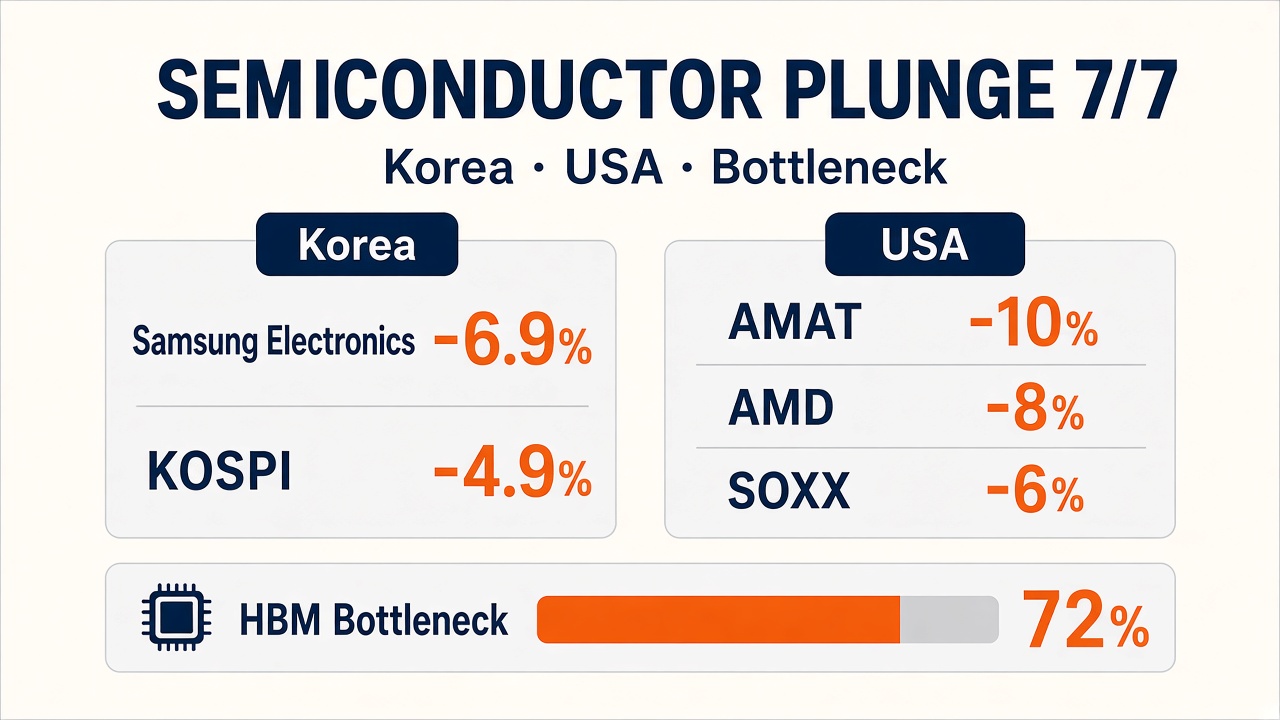
On July 7, 2026, Korea, the U.S., and Europe sold off semiconductors together. Samsung guided Q2 operating profit of ₩89.4T (+~1,810% YoY) — a record — yet markets sold the news globally.
Korea: Samsung -6.92%, SK hynix -6.06%, KOSPI -4.91%. U.S.: SOXX ~-6%, Applied Materials ~-10%, AMD ~-8%, Intel ~-10%, Micron ~-6%. Europe: ASML ~-5% and peers (Yahoo). One Samsung print repriced the entire global chip trade.
This article: global Jul 7 drivers → bottleneck primer → scenario probabilities.
Not investment advice. Probability bars are scenario weights, not additive to 100%.
Jul 7 — four layers
① Sell-on-news — record but expectations were higher.
② Earnings growth peak — focus on slowing growth rates.
③ AI rotation — Morgan Stanley pivot to hyperscalers; Meta excess-compute narrative hit SOXX.
④ Equipment/design leverage — AMAT/Intel ~-10%, AMD ~-8% on capex and custom-chip fears.
Market focus
Growth-rate peak
Keyword
Flows · Foreigners·profit-taking
Spillover · Equipment AMAT -10%
Earnings said
₩89.4T (+1810% YoY)
Samsung OI
Memory · AI demand·ASP surge
HBM · Tight into 2027
Jul 7 — Korea & US decline chart
Jul 7 Korea US semiconductor declines. Jul 7, 2026 % moves (absolute). KR/US sources. Not advice.
What a bottleneck is
A bottleneck is the narrowest step in the chain — it caps total output. AI GPUs face three largely independent axes: TSMC logic die, HBM3e memory, and CoWoS packaging. Jul 7’s debate: Samsung/SK profits prove HBM pricing power today — but are we at a margin peak?
-
1
① Logic die
TSMC N4/N3 fab
-
2
② HBM3e
SK hynix·Samsung·Micron
-
3
③ CoWoS
TSMC packaging
-
4
→ GPU
Nvidia H200/B200
Future binds — scenario weights
HBM (72%), CoWoS (68%), power/grid (58%), ABF substrate (45%), memory glut (42%), custom ASIC (38%), advanced fab (35%), EUV (32%) — author framework for 2026 H2–2028.
Bottleneck probability — chart
Future semiconductor bottleneck probability. Author scenario weights for which bind dominates supply/pricing. Not additive to 100%. Not advice.
Calendar checklist
Jul 30 Samsung full results · late-July hyperscaler capex guidance · DRAM/HBM ASP trend · CoWoS/HBM capacity adds.
Wrap-up
Jul 7 was repricing of peak growth and rotation, not broken fundamentals — yet memory-cycle risk rose. Bottleneck map helps read headline profits in context.
One line. On semi earnings days, trade the expectation gap, not the absolute trillion-won print.
Jul 7 hit Korea and the U.S. together — on earnings day, trade the expectation gap.
Sources
- IT Chosun — KOSPI -4.91% Jul 7
- MoneyToday — sell-on-news
- Chosun Biz — growth peak / foreign selling
- 24/7 Wall St — global chip selloff
- Yahoo — Samsung spooks chip trade
- Euronews — $100bn mkt cap wipe
- CNA — Morgan Stanley rotation
- Super Financial — H200 supply chain
- Internal: 2026-07-08-semiconductor-selloff-bottleneck-session-01.md
For information only — this is not a recommendation to buy or sell any asset.
Comments 0