Korea Nominal GDP Growth Hits 26.4% — Why Profits Rose Before Paychecks (Views 0)
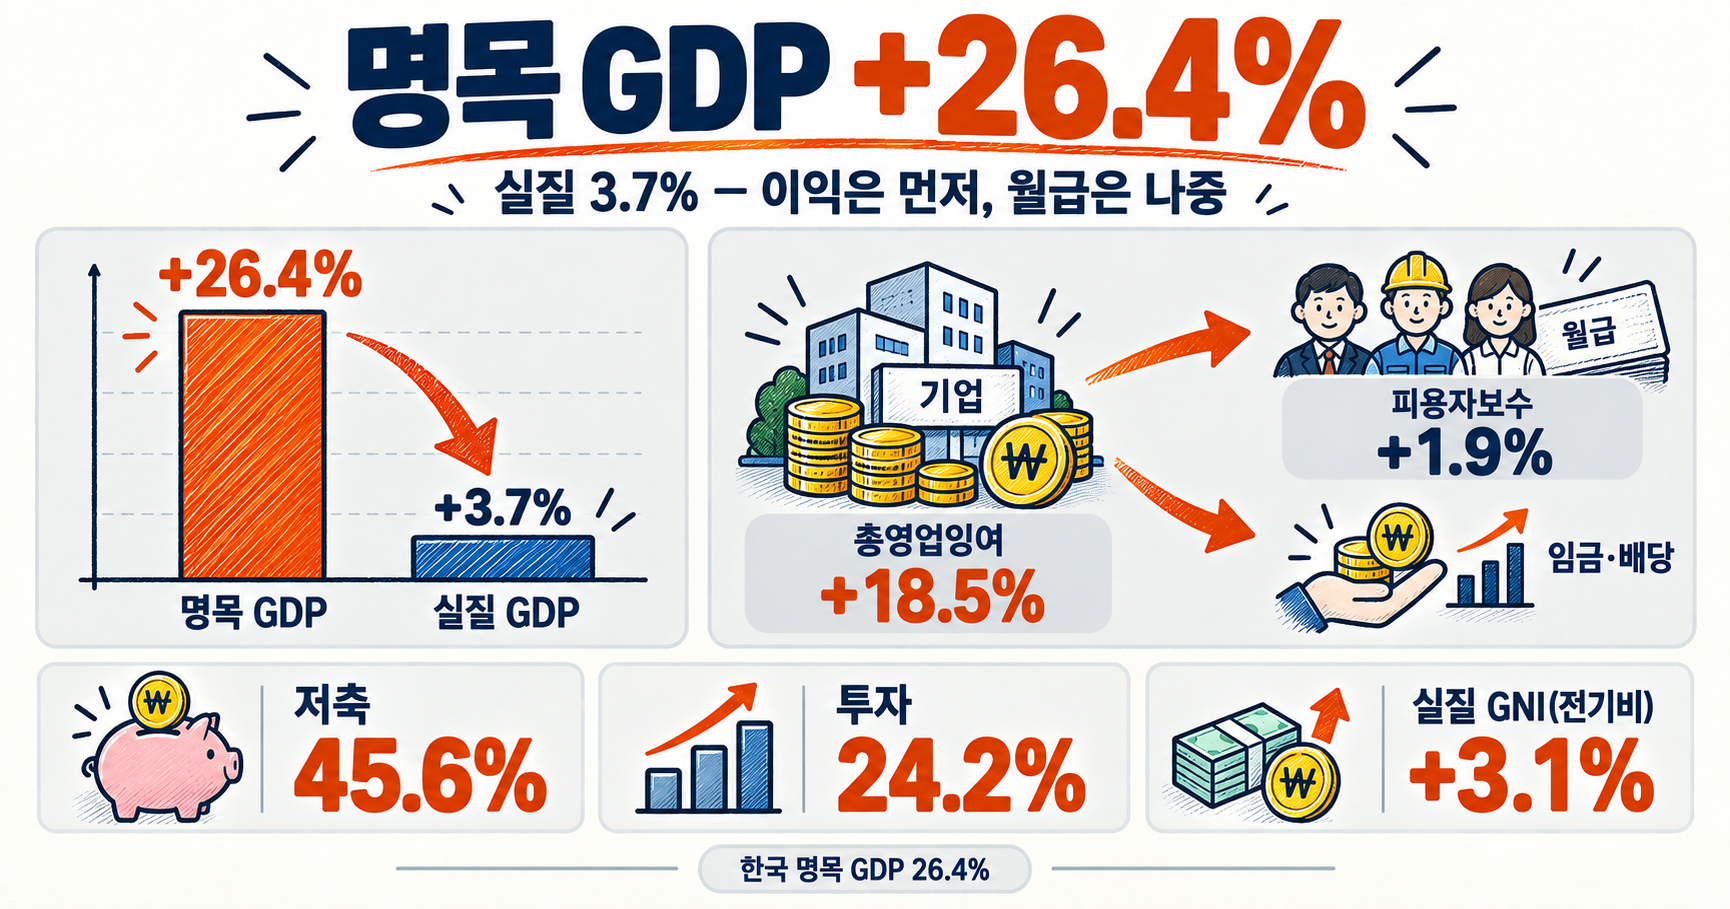
Korea nominal GDP growth of 26.4% does not mean the economy produced 26.4% more goods and services. In the Bank of Korea’s preliminary data for the second quarter of 2026, real GDP rose 3.7% year on year and 0.6% quarter on quarter.
The number is not meaningless. Higher export prices and a lighter relative import bill can leave more income in Korea even when physical output grows modestly. For now, much of that gain remains in corporate accounts rather than household paychecks.
The economic data below are verified BOK figures. Statements about where profits and markets go next are conditional scenarios, not investment advice.
Why Korea nominal GDP growth of 26.4% differs from real growth
Nominal GDP values domestic production at current prices. If a factory sells 100 phones at a higher price without making more phones, nominal output rises. Real GDP applies reference-year prices and removes that price effect, making it the better measure of production volume.
On the same year-on-year basis, nominal GDP rose 26.4% while real GDP increased 3.7%. The ratio implies a GDP deflator increase of about 21.9%. That figure is a calculation derived from the two official growth rates, not a separate BOK inflation forecast.
Breaking down the 26.4% headline
Nominal vs realNominal GDP +26.4%
Real GDP +3.7%
Difference between Korea nominal GDP growth of 26.4% and real GDP growth of 3.7%. Year on year. The 21.9% deflator is derived from the two official growth rates.
The GDP deflator covers prices of all final goods and services produced domestically. It is broader than consumer inflation, which tracks a household basket. Export prices for chips and ships, as well as their won value, matter greatly. It would therefore be wrong to say household prices rose 22%.
Why higher chip prices mean more income for Korea
The key is the terms of trade: how much a country can import with one unit of exports. When chip export prices rise relative to energy and raw-material import prices, Korea can buy more imports with the same export volume. The country’s purchasing power improves.
That effect appeared directly in income. Real gross national income rose 3.1% from the previous quarter, far above real GDP growth of 0.6%. GNI adds income received from abroad to domestic production income and subtracts income paid overseas. The BOK attributed the gap mainly to larger real trading gains from better terms of trade.
How export prices can reach domestic demand
Income transmissionFlow from export prices to profits, pay, dividends and consumption. Later stages depend on corporate distribution and household behavior.
The expansion was not confined to chips. Manufacturing grew 1.4% and services 1.0% quarter on quarter. The BOK said improvement spread into refining, chemicals, machinery, ships and retail. Construction, however, contracted 1.9%. Export factories and building sites are living through very different economies.
Why corporate surplus rose 18.5% while employee pay rose 1.9%
Gross operating surplus, a broad measure close to corporate income, jumped 18.5% from the first quarter. Compensation of employees rose only 1.9%. Export prices enter revenue quickly, while wages adjust through annual contracts and negotiations. The lag is normal. It also means the gain has not appeared on most payslips yet.
Bonuses, wage increases, dividends and taxes are the next channels. If companies distribute profits and the government spends higher tax receipts, household income and consumption can follow. The BOK expects distribution through dividends and taxes to become more visible later in the year. That is an outlook, not evidence that consumption has already surged.
Private consumption grew 0.4% in the quarter. As our article on AI investment and employment explained, capital-intensive chip growth may not create jobs as quickly as revenue. If bonuses and dividends reach a narrow group, the economy-wide spending effect can also remain weak.
A 45.6% saving rate beside a 24.2% investment rate
This combination looks odd at first. The gross saving rate reached a record 45.6%, while the domestic investment rate fell 1.1 percentage points to 24.2%. Gross saving includes retained corporate income and government saving, not just household deposits. The profit jump is the most natural explanation for much of this quarter’s record.
Saving can finance investment, but it does not automatically become factories or jobs. Equipment investment rose just 0.2% and construction investment fell 0.1%. Investment in intellectual property, including research and software, increased 3.4%. Capital moved more readily into technology than buildings.
Income surged, domestic investment lagged
Q2 2026 shareKorea gross saving rate 45.6% versus domestic investment rate 24.2%. Gross saving and domestic investment rates, BOK.
The gap between the saving and investment rates is 21.4 percentage points. If it persists, income not spent at home is likely to appear in the current-account surplus and purchases of foreign assets. Export surpluses can support the won, while outbound investment creates dollar demand. The currency effect is not one-way.
Where profits flow next — earnings, spending and stocks
For earnings, the question is how far gains spread beyond memory chips. Chip prices help memory makers and their equipment and materials suppliers. High-value ships, cosmetics and pharmaceutical exports, and refining margins also contributed. Domestic companies that import heavily and cannot pass costs to customers may still feel little benefit.
For consumption, wages and dividends are the next signal. Bonuses could lift cars, appliances and travel first. Yet high interest and housing costs may divert extra income toward debt repayment. Companies may also retain cash, leaving the saving rate high and the spending response muted.
For stocks, better earnings expectations for large exporters are supportive, but valuation is a separate question. If investors have already priced in the good news, strong GDP data alone are not enough. Export-price reversals could slow earnings abruptly. China’s expanding supply, discussed in our China exports analysis, is another risk for commodity chips, chemicals and steel.
Four numbers will answer the next-quarter question
First, separate semiconductor export prices from shipment volumes. Second, track the gap between operating surplus and employee compensation. A narrowing gap would show that the boom is reaching household income.
Third, watch equipment and construction investment for evidence that profit is becoming capacity and jobs. Fourth, follow the terms of trade. Falling export prices or a larger oil import bill could reverse the surge in real income.
My reading is that 26.4% is not a fake number; it is a number that has not yet been widely distributed. Export prices and corporate profits moved first. If income flows into pay, dividends, taxes and investment, the recovery can broaden. If it does not, Korea may be left with a hot semiconductor sector and a much cooler domestic economy.
The 26.4% is not fake; it has not yet been widely distributed. The next question is whether profits move into pay, dividends and investment.
Sources
- Bank of Korea — Q2 2026 Gross National Income (preliminary)
- KDI / Bank of Korea — 2026 Q2 national income details
- Yonhap — nominal GDP growth reaches a 47-year high
- Bank of Korea — Q2 2026 corporate business analysis
- World Bank — Global Economic Prospects, June 2026
- IMF — G20 finance ministers statement, September 2026
- 내부 글 — AI 투자와 고용의 엇갈림
- 내부 글 — 중국 수출 급증의 한국 산업 영향
- 내부 글 — 유가와 한국 기업 비용
한국 명목 GDP 26.4% 급증 — 내 월급보다 기업이익이 먼저 뛴 이유 (조회수 0)
한국 명목 GDP 26.4% 급증은 생산량이 26.4% 늘었다는 뜻이 아닙니다. 한국은행의 2026년 2분기 잠정치에서 물가 영향을 뺀 실질 GDP는 전년보다 3.7%, 전 분기보다 0.6% 늘었습니다.
그래도 26.4%를 단순한 착시라고 치워 버리면 중요한 절반을 놓칩니다. 한국이 해외에 파는 제품의 가격이 뛰고 수입 부담이 상대적으로 줄면, 같은 생산량으로도 국내에 남는 소득이 커집니다. 문제는 그 돈이 아직 기업 장부에 많이 머물러 있다는 점입니다.
아래 경제지표는 한국은행 발표로 확인한 사실입니다. 기업이익이 가계소득과 증시로 이어지는 부분은 조건을 붙인 전망이며, 특정 자산의 매수·매도를 권하는 내용이 아닙니다.
한국 명목 GDP 26.4%, 실질 GDP 3.7%와 왜 다를까?
명목 GDP는 그해 가격으로 계산한 국내 생산액입니다. 스마트폰 100대를 대당 100만원에 팔면 1억원입니다. 생산량은 그대로인데 가격만 120만원으로 오르면 명목 생산액은 20% 늘어납니다. 실질 GDP는 기준연도 가격을 적용해 이 가격 효과를 걷어 냅니다. 실제 생산량 변화를 보려면 실질 GDP가 더 알맞습니다.
같은 전년동기 기준으로 놓으면 명목 GDP는 26.4%, 실질 GDP는 3.7% 증가했습니다. 두 지수의 비율로 계산한 GDP 디플레이터 상승률은 약 21.9%입니다. 이 21.9%는 한국은행이 별도로 제시한 물가 전망이 아니라 공식 성장률 두 개로 계산한 파생값입니다.
26.4%를 두 조각으로 보기
명목 vs 실질명목 GDP +26.4%
실질 GDP +3.7%
한국 명목 GDP 26.4%와 실질 GDP 3.7% 차이. 전년동기 대비. 디플레이터 21.9%는 두 공식 성장률로 계산한 파생값입니다.
GDP 디플레이터는 국내에서 만든 모든 최종재와 서비스의 가격을 넓게 봅니다. 소비자의 장바구니만 재는 소비자물가와 범위가 다릅니다. 반도체와 선박 같은 수출품 가격, 원화 환산액도 영향을 줍니다. 그러니 이 숫자를 두고 ‘생활물가가 22% 올랐다’고 읽으면 틀립니다.
반도체 수출가격이 오르면 한국 소득은 왜 같이 뛸까
열쇠는 교역조건입니다. 교역조건은 수출품 한 단위로 수입품을 얼마나 살 수 있는지를 보여 줍니다. 반도체 수출가격이 오르고 에너지·원자재 수입가격 부담이 상대적으로 낮아지면, 똑같은 수출 물량으로 더 많은 수입품을 살 수 있습니다. 나라 전체의 구매력이 좋아지는 겁니다.
그 효과는 소득 통계에 바로 보였습니다. 실질 국민총소득(GNI)은 전 분기보다 3.1% 늘어 실질 GDP 증가율 0.6%를 크게 웃돌았습니다. GNI는 국내 생산에서 벌어들인 소득에 해외에서 받은 몫을 더하고 해외로 지급한 몫을 뺀 값입니다. 한국은행은 교역조건 개선으로 실질무역이익이 늘어난 점을 이 격차의 주된 이유로 설명했습니다.
수출가격이 내수로 가는 길
소득 전달 경로수출가격 상승이 기업이익과 임금 배당 소비로 전달되는 흐름. 뒤 단계는 자동이 아니라 기업의 배분과 가계 행동에 달렸습니다.
생산도 반도체 한 업종만 움직인 것은 아닙니다. 제조업은 전 분기보다 1.4%, 서비스업은 1.0% 늘었습니다. 한국은행 설명으로는 정유, 화학, 기계·장비, 선박, 도소매까지 실적 개선이 퍼졌습니다. 다만 건설업은 1.9% 줄었습니다. 수출 공장은 뜨거운데 건설 현장은 차가운, 조금 낯선 회복입니다.
기업이익 18.5%가 월급 1.9%보다 먼저 뛴 이유
소득이 누구에게 먼저 갔는지를 보면 체감경기와의 차이가 선명합니다. 기업 몫에 가까운 총영업잉여는 전 분기보다 18.5% 늘었지만, 근로자가 받은 보수인 피용자보수는 1.9% 증가했습니다. 수출가격 상승은 기업 매출과 이익에 곧바로 잡힙니다. 임금은 연봉 계약과 협상을 거쳐야 하니 시간 차가 생깁니다. 월급명세서에는 아직 안 찍혔다는 뜻입니다.
다음 통로는 성과급, 임금 인상, 배당, 법인세입니다. 기업이 이익을 직원과 주주에게 나누고 정부가 늘어난 세수를 지출하면 가계소득과 소비가 뒤따를 수 있습니다. 한국은행도 하반기부터 배당과 세금 등을 통한 분배가 가시화될 수 있다고 봤습니다. 다만 이것은 전망입니다. 소비가 이미 크게 뛰었다는 뜻은 아닙니다.
실제 2분기 민간소비는 전 분기보다 0.4% 늘었습니다. 회복은 맞지만 기업이익 증가 속도와는 거리가 큽니다. AI 투자와 고용의 엇갈림에서 봤듯 자본집약적인 반도체 호황은 매출만큼 일자리를 빠르게 늘리지 않을 수 있습니다. 보너스와 배당을 받는 가계가 일부에 그치면 소비로 퍼지는 힘도 약해집니다.
저축률 45.6%인데 투자율 24.2%인 이상한 간격
솔직히 이 숫자 조합은 좀 이상합니다. 총저축률은 45.6%로 통계 작성 이후 최고인데 국내총투자율은 24.2%로 오히려 1.1%포인트 낮아졌습니다. 여기서 총저축은 가계의 예금만 뜻하지 않습니다. 기업이 벌고도 배당이나 투자로 쓰지 않은 돈과 정부가 남긴 소득도 포함합니다. 이번 기록은 기업이익 급증이 크게 밀어 올렸다고 보는 편이 자연스럽습니다.
저축은 미래 투자 재원이지만 자동으로 공장과 일자리가 되지는 않습니다. 수요가 확실하고 전력·부지·장비가 준비돼야 기업이 설비를 늘립니다. 2분기 설비투자는 0.2% 증가에 그쳤고 건설투자는 0.1% 감소했습니다. 반면 연구개발과 소프트웨어를 포함한 지식재산생산물투자는 3.4% 늘었습니다. 돈이 건물보다 기술과 소프트웨어 쪽으로 더 빨리 움직였습니다.
소득은 늘었지만 국내 투자는 덜 늘었습니다
2026년 2분기 비율한국 총저축률 45.6%와 국내총투자율 24.2% 비교. 총저축률과 국내총투자율, 한국은행.
저축률과 투자율의 차이는 21.4%포인트입니다. 이 간격이 이어지면 국내에서 다 쓰지 않은 소득은 경상수지 흑자와 해외자산 매입으로 연결될 가능성이 큽니다. 수출 흑자는 원화를 받쳐 줄 수 있지만 해외투자가 늘면 달러 수요도 함께 커집니다. 환율 효과가 한 방향으로만 움직이지 않는 이유입니다.
이익이 번지면 어디가 먼저 움직이나 — 실적·소비·증시
기업 실적에서는 매출 증가율보다 이익이 어디까지 퍼지는지 봐야 합니다. 반도체 가격 상승은 메모리 업체와 장비·소재 기업에 유리합니다. 고부가 선박, 화장품·의약품 수출, 정제마진 개선도 힘을 보탰습니다. 반대로 원자재를 많이 수입하면서 비용을 판매가격에 넘기기 어려운 내수기업은 같은 GDP 호황을 거의 느끼지 못할 수 있습니다.
소비에서는 임금과 배당이 다음 신호입니다. 성과급과 배당이 늘면 자동차·가전·여행처럼 소득 변화에 민감한 지출이 먼저 움직일 수 있습니다. 하지만 금리와 주거비 부담이 크면 늘어난 돈이 소비 대신 대출 상환으로 갑니다. 기업이 현금을 계속 쌓는 경우에도 저축률만 높고 내수 반응은 약하게 남습니다.
증시에는 수출 대형주의 이익 전망 개선이 우호적입니다. 하지만 좋은 실적을 예상한 가격이 이미 주가에 들어가 있는지는 별개의 문제입니다. 수출가격이 꺾이면 이익 증가율도 빠르게 낮아집니다. 중국 수출 급증의 한국 산업 영향처럼 중국의 공급 확대가 범용 반도체·화학·철강 가격을 누르는 위험도 같이 봐야 합니다.
다음 분기, 이 네 숫자에서 답이 나옵니다
먼저 반도체 수출단가와 물량을 나눠 봐야 합니다. 가격만 오른 것인지 출하량도 늘었는지가 중요합니다. 다음은 총영업잉여와 피용자보수의 차이입니다. 임금과 성과급이 따라오면 호황이 가계소득으로 넓어지고 있다는 증거가 됩니다.
설비투자와 건설투자는 이익이 생산능력과 일자리로 바뀌는지를 보여 줍니다. 마지막은 교역조건입니다. 수출가격이 꺾이거나 유가 상승으로 수입 부담이 커지면 실질 GNI의 빠른 증가도 되돌아갈 수 있습니다.
제 판단으로는 26.4%는 가짜 숫자가 아니라 아직 고르게 나뉘지 않은 숫자입니다. 한국 경제에서는 생산량보다 수출가격과 기업이익이 먼저 뛰었습니다. 이제 그 이익이 임금·배당·세수·투자로 이동하는지가 중요합니다. 이동하면 내수와 증시의 폭이 넓어집니다. 멈추면 반도체 대기업만 뜨겁고 나머지는 서늘한 회복으로 남을 수 있습니다.
26.4%는 가짜 숫자가 아니라 아직 고르게 나뉘지 않은 숫자입니다. 다음 질문은 이익이 임금·배당·투자로 이동하느냐입니다.
출처
- Bank of Korea — Q2 2026 Gross National Income (preliminary)
- KDI / Bank of Korea — 2026 Q2 national income details
- Yonhap — nominal GDP growth reaches a 47-year high
- Bank of Korea — Q2 2026 corporate business analysis
- World Bank — Global Economic Prospects, June 2026
- IMF — G20 finance ministers statement, September 2026
- 내부 글 — AI 투자와 고용의 엇갈림
- 내부 글 — 중국 수출 급증의 한국 산업 영향
- 내부 글 — 유가와 한국 기업 비용
답글 남기기