반도체 3배 레버리지 청산 — SOXX −25%·SOXL −63% 후 반등Semiconductor 3x Leverage Liquidation — SOXX −25%, SOXL −63%, Then Rebound
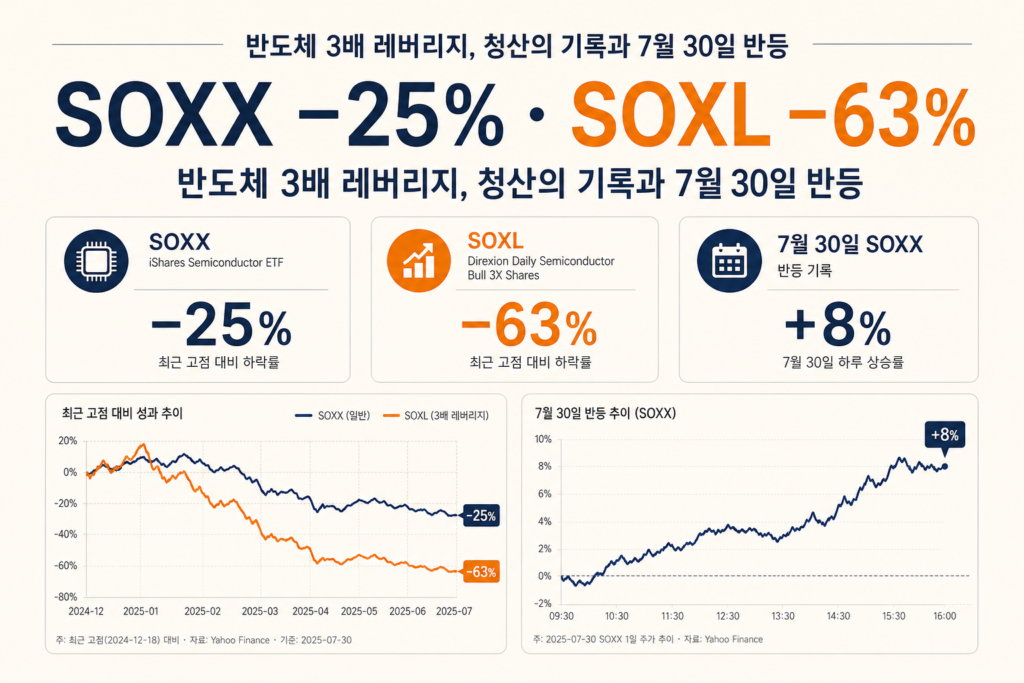
반도체 3배 레버리지를 들고 있던 사람이라면, 지난 몇 주가 유난히 길었을 겁니다. 비레버리지 반도체 ETF인 SOXX는 6월 22일 고점 이후 대략 25% 가까이 빠졌고, 하루 수익률 3배를 목표로 하는 SOXL은 같은 구간에서 약 63% 하락했습니다. 고점 대비 20~30%대 조정이 ‘지수’ 쪽 이야기고, 레버리지를 탄 쪽은 그보다 훨씬 깊게 깎였습니다.
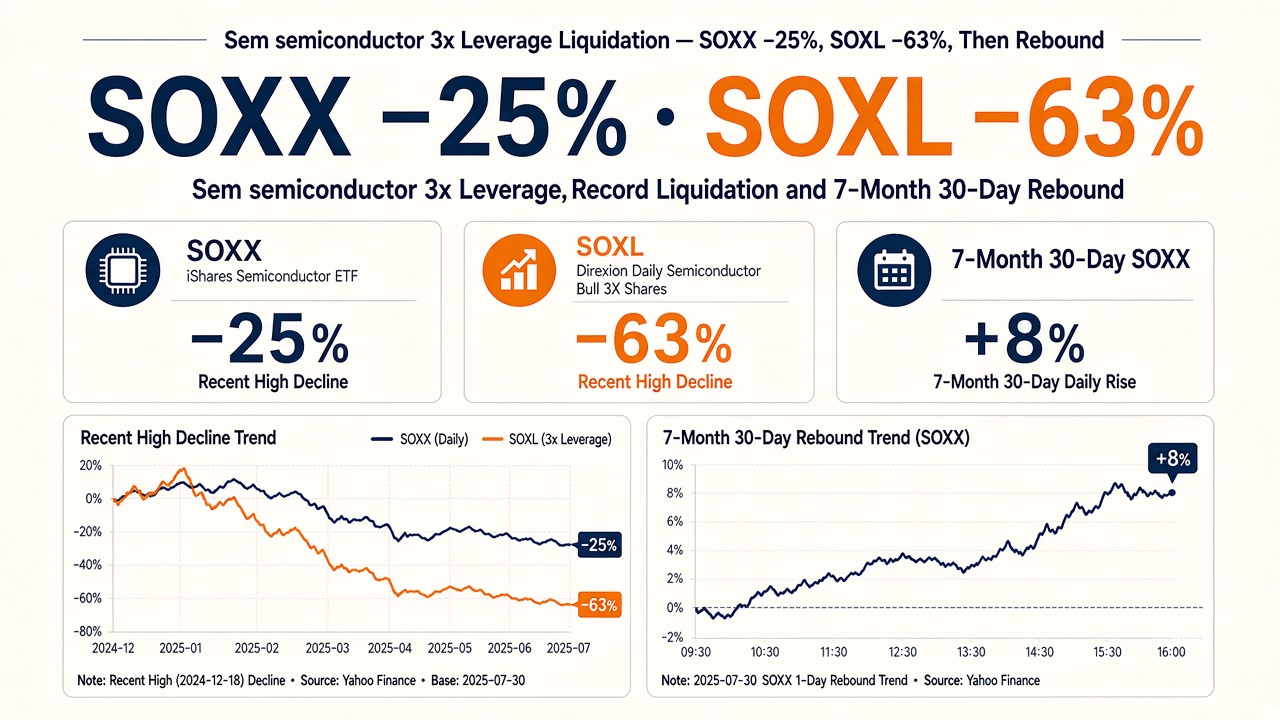
If you held 3x semiconductor leverage, the past few weeks felt endless. The unlevered iShares Semiconductor ETF (SOXX) fell roughly 25% from its June 22 peak, while Direxion’s daily 3x bull fund (SOXL) dropped about 63% over the same stretch. A 20–30% sector drawdown is the index story; leverage made the personal story much worse.
그런데 2026년 7월 30일(목)에는 분위기가 갑자기 바뀌었습니다. SOXX가 약 +8% 올랐고, 마이크론·AMD·SK하이닉스 ADR이 두 자릿수 급등했습니다. 나스닥은 +2.8%로 6거래일 연속 하락을 끊었습니다. 촉매는 Microsoft의 Azure 실적이었습니다.
그래서 질문이 나옵니다. 이거, 3배 레버리지 청산시키려고 일부러 떨어뜨린 거 아닌가? 결론부터 말하면, ‘누가 개인 SOXL만 노리고 설계했다’는 단일 음모의 증거는 공개 보도에 없습니다. 다만 마진콜·강제청산·레버리지 ETF 일일 리밸런싱이 실제로 연쇄했고, 그 구조가 급락과 급반등을 키운 것은 맞습니다. 이 글은 그 기술·시장 구조를 풀어 씁니다. 특정 상품의 매수·매도 권유가 아닙니다.
한눈에 — 빠진 폭과 어제 반등
먼저 숫자만 나란히 둡니다. ‘지수(또는 비레버리지 ETF)’와 ‘3배 상품’은 같은 반도체 이야기를 해도, 체감 손실이 전혀 다릅니다.
- 고점 대비(대략): SOXX −25% / SOXL −63% (6월 22일 부근 고점 기준, 복수 보도)
- 원금 회복에 필요한 반등(대략): SOXX +33% / SOXL +170% — 변동성이 크면 SOXL은 더 불리
- 7월 30일: SOXX 약 +8~8.5%, MU +15~18%, AMD +12~13%, SK하이닉스 ADR +15~17%, NVDA +약 2~3%
- 촉매: MSFT +약 16%(Azure +43%, FY Azure $100B+). Meta는 FCF −91%로 −8~9%
SOXX와 SOXL 고점 대비 하락률 막대 그래프. 고점(대략 6/22) 대비 하락률. 복수 보도 종합. 투자 권유 아님.
3배 레버리지 ETF가 뭔지부터
레버리지 ETF는 거래소에서 주식처럼 사고팔 수 있는 펀드인데, 하루 기준으로 기초지수 수익률의 배수(예: 3배)를 맞추려고 설계된 상품입니다. SOXL은 뉴욕 반도체 관련 지수의 일일 수익률 3배를 목표로 합니다. ‘장기적으로 반도체가 3배 오른다’는 뜻이 아닙니다.
운용사(Direxion)는 현물 주식만으로 3배를 만들기 어렵기 때문에, 스왑·선물 같은 파생상품으로 노출을 키웁니다. 보도에 따르면 SOXL은 순자산 대비 스왑·선물 명목이 대략 절반 가까이 됩니다. 상대방(은행 등)은 그 자금을 빌려 주는 대가로 단기금리(SOFR)에 스프레드를 붙입니다. 이 비용은 수수료 줄에 깔끔히 안 나오고, 매일 성과에 스며듭니다.
표시 총보수가 연 0.7%대라고 해서, 몇 달 들고 있을 때 실제 비용이 그만큼만인 것은 아닙니다. 공시 문구도 분명합니다. 하루를 넘는 기간에 ‘지수의 3배’가 나온다고 기대하면 안 된다고 적혀 있습니다.
일일 리셋 — 왜 −25%인데 −63%가 되나
은 매일 밤 다시 맞춘다는 점입니다. 지수가 하루 −10%면 3배 상품은 그날 약 −30%를 목표로 움직입니다. 자산이 줄었으니, 다음 날에도 ‘3배’를 유지하려면 파생 노출을 줄여야 합니다(매도). 다음 날 지수가 +10% 반등해도, 이미 작아진 자산의 3배만 오릅니다. 지수는 거의 제자리인데 레버리지 상품은 깎여 있습니다.
숫자로만 보면 이렇습니다. 100에서 시작해 첫째 날 −10%면 90, 둘째 날 +11.11%면 다시 100입니다. 3배는 첫째 날 70, 둘째 날 70×1.333≈93.3입니다. 지수는 회복했는데 3배는 아직 구멍을 못 메웁니다. 이런 현상을 변동성 감쇠(volatility decay), 또는 경로 의존성이라고 부릅니다.
지난 5주처럼 큰 폭으로 출렁이면서 내려가면, ‘3×25%=75%’가 아니라 보도된 것처럼 약 63%처럼 나올 수 있습니다. 반대로 한쪽 방향으로만 쭉 가면 복리가 유리해지기도 합니다. 상품이 고장난 게 아니라, 하루짜리 도구를 여러 날 붙잡은 결과입니다.
-
1
당일 지수 하락
-
2
3배 ETF 더 큰 % 손실
-
3
자산 축소 → 노출 축소(매도)
-
4
다음날 반등해도 작은 자산의 3배만
-
5
지수는 회복, 레버리지는 구멍
강제청산·마진콜은 실제로 있나
있습니다. 다만 ‘세력이 SOXL 보유자만 노렸다’와는 결이 다릅니다. 시장에는 서로 다른 층의 레버리지가 겹쳐 있습니다.
마진콜은 빌린 돈(또는 프라임 브로커 신용)으로 주식을 산 뒤, 담보 가치가 떨어지면 증권사·프라임이 ‘담보를 더 내라’고 요구하는 일입니다. 못 채우면 강제청산—포지션을 강제로 줄이거나 팝니다. 헤지펀드도 개인 신용계좌도 같은 논리입니다. 계약과 리스크 한도에 따른 자동·준자동 반응에 가깝습니다.
7월 말 보도를 보면 Goldman Sachs·JPMorgan 등이 AI·메모리에 몰린 헤지펀드에 추가 담보를 요구했다는 이야기가 나왔습니다. Goldman 쪽 설명으로는 6월 말 프라임 익스포저의 약 16%가 AI 메모리 관련주였습니다. 전 OpenAI 연구원 Leopold Aschenbrenner의 Situational Awareness 펀드는 공개주식 포지션을 줄이며 마진을 맞추는 과정이 보도됐습니다.
JPMorgan의 Nikolaos Panigirtzoglou는 수요일 노트에서, 테크·반도체·메모리 쪽 디레버리징이 예상보다 빨랐고, 추가 디레버 여지는 제한적이라고 봤습니다. ‘청산이 끝났다’는 단정이라기보다, 레버리지 줄이기 압력이 한동안 세게 작동했다는 신호로 읽는 편이 맞습니다.
청산 캐스케이드 — ‘털고 반등’처럼 보이는 이유
청산 캐스케이드(liquidation cascade)는 한 번의 매도가 가격을 더 밀어, 또 다른 레버리지 청산을 부르는 연쇄입니다. 가격이 내려가면 레버리지 ETF는 노출을 줄이려고 파생을 팔고, 신용·선물 계좌는 담보비율이 깨지며 팔고, 손절(스탑) 주문이 몰리면 같은 방향으로 더 팝니다.
한국 시장에서도 비슷한 증폭이 보였습니다. 삼성전자·SK하이닉스 개별주 2배 ETF가 커지면서, 하락일에는 선물 쪽 기계적 매도가 종가 부근에 몰리고, 현물·지수 변동성을 키운다는 증권가·언론 해설이 나왔습니다. ‘의도적 사냥’이라기보다, 상품 설계가 변동성을 키우는 구조에 가깝습니다.
그래서 급락 뒤 급반등이 ‘스탑 잡고 올려 쳤다’처럼 보일 수 있습니다. 실제로 많은 경우, (1) 레버리지가 한동안 줄고 (2) 악재가 소진되거나 호재가 뜨면 (3) 숏커버·ETF의 상승일 매수 리밸런싱이 겹치며 반등이 가팔라집니다. 7월 30일이 그 조합에 가깝습니다.
-
1
가격 하락
-
2
마진콜·스탑·ETF 매도
-
3
추가 하락
-
4
레버리지 축소·악재 소진
-
5
호재 + 숏커버·상승일 리밸런싱
-
6
급반등
어제 반등 — Microsoft Azure가 연 스위치
반등의 표면 스위치는 펀더멘털이었습니다. Microsoft가 분기 매출 $900억으로 기대를 웃돌았고, Azure는 상수통화 기준 +43%(시장 기대 약 40%)를 기록했습니다. 회계연도 Azure 매출이 $1000억을 넘었다는 점도 ‘AI에 쓴 돈이 매출로 돌아온다’는 서사를 강하게 밀었습니다.
같은 날 Meta는 자유현금흐름이 전년 대비 약 91% 줄었다는 점과 약한 매출 가이던스로 하락했습니다. 시장이 묻는 질문은 ‘AI를 쓰느냐’가 아니라 쓴 돈이 이익·매출로 연결되느냐였고, Microsoft는 합격, Meta는 미흡으로 읽힌 하루였습니다. 반도체는 그 합격 쪽에 붙어 올랐습니다.
여기에 앞서 말한 디레버 국면이 겹칩니다. 레버리지가 이미 많이 줄인 뒤에는, 같은 호재에도 매도 압력이 약해지고, 반대로 기계적 매수·숏커버가 나오기 쉽습니다. ‘3배를 털려고 떨어뜨린 뒤 올렸다’기보다, 레버리지 언와인드가 지나간 자리에 실적 촉매가 떨어진 그림에 가깝습니다.
기술은 괜찮았나 — 칩 수요와 주가 레버리지는 별개
가격이 20~25% 빠졌다고 해서 HBM이 갑자기 남아돌거나, CoWoS 패키징 병목이 풀린 것은 아닙니다. 다수 보도와 애널리스트 코멘트는 여전히 HBM이 2027년까지 타이트하고, 반도체 업종 이익 성장 추정치도 높은 편이라고 말합니다. 이번 조정의 중심은 ‘칩이 안 팔린다’보다 AI 설비투자 수익률·밸류에이션 의심이었습니다.
그래서 투자 관점에서는 두 질문을 分け야 합니다. 하나는 공급망·수요(기술·산업)이고, 다른 하나는 누가 몇 배로 탔는지(금융 구조)입니다. 산업이 멀쩡해도 레버리지가 과도하면 주가는 훨씬 크게 출렁입니다. 반대로 레버리지가 걷힌 뒤에는, 같은 실적에도 반등이 빨라 보일 수 있습니다.
참고로 하락 중에도 SOXX·SMH·DRAM·SOXL로 약 $247억이 들어온 보도가 있습니다. SOXL만 약 $51억입니다. ‘다 털렸다’와 ‘일부는 더 샀다’가 동시에 일어난 구간입니다. 레버리지 상품으로 저가 매수를 반복하면, 일일 리셋 비용까지 감수하는 베팅이 됩니다.
스탑헌팅 음모와 구조의 차이
커뮤니티에서 말하는 스탑헌팅은 ‘큰손이 손절가 밀집 구간까지 가격을 밀어 청산을 유도한 뒤 되돌린다’는 이야기입니다. 단기적으로 유동성이 얇은 구간에서 가격이 과하게 뚫리는 일은 있습니다. 다만 이번처럼 수주에 걸친 섹터 −20%대와 SOXL −60%대는, 그보다 밸류에이션 재가격 + 기관 디레버 + ETF 기계 매매로 설명하는 편이 공개 자료와 맞습니다.
- 있는 것: 마진콜, 강제청산, 레버리지 ETF 일일 매도·매수, 손절·신용 연쇄
- 과장하기 쉬운 것: ‘개인 3배만 노린 단일 세력의 작전’
- 실무적으로 볼 것: 하루짜리 3배 상품을 며칠·몇 주 들고 있으면 경로가 곧 손익
관련해서는 앞서 정리한 반도체 매도·병목 전망, 상품 구조를 더 보고 싶다면 국내·해외 ETF 세금·보수 가이드, 그리고 넓은 미국장 맥락은 미국 증시 조정·DXY 역사도 함께 보면 흐름이 이어집니다.
정리 — 무엇을 기억하면 되나
고점 대비 반도체 20~30%대 하락과 7월 30일 급반등은, ‘3배 청산용 연출’ 한 줄로 끝나지 않습니다. 실재한 것은 헤지펀드·프라임 쪽 디레버리징, 레버리지 ETF의 일일 리셋, 그리고 Microsoft Azure라는 실적 스위치입니다. 그 조합이 급락의 깊이와 반등의 가파름을 키웠습니다.
SOXL이 −63%까지 간 뒤 원금으로 돌아가려면, 단순 계산만으로도 약 +170%가 필요합니다. 반등이 출렁이면 그 숫자도 더 커질 수 있습니다. 반도체를 긍정적으로 보더라도, 비레버리지 ETF·개별주와 3배 상품은 같은 자산이 아닙니다.
로 남기면 이렇습니다. 레버리지는 방향을 맞혀도, 경로가 거칠면 깎입니다. 어제 올랐다고 해서, 지난 몇 주의 구조적 비용이 자동으로 환급되지는 않습니다. 이 글은 시장 구조를 설명하기 위한 것이며, 투자 권유가 아닙니다. 숫자·보도는 시간이 지나면 갱신됩니다.
레버리지는 방향을 맞혀도, 경로가 거칠면 깎입니다 — 일일 리셋은 출렁임을 용서하지 않습니다.
출처
- CNBC — Jul 30 market / JPM delever
- Yahoo Finance — leverage cost of chip crash
- TechTimes — SOXL −63% vs SOXX −25%
- Motley Fool — MSFT Azure / chip rebound
- Chosun Biz — Korea leveraged ETF whiplash
- Khan Capital — SOX bear market
- Internal: 2026-07-31-semi-leverage-liquidation-rebound-session-01.md
Then Thursday, July 30, 2026 flipped the tape. SOXX jumped about 8%. Micron, AMD, and SK Hynix ADRs posted double-digit gains. The Nasdaq rose 2.8% and ended a six-day losing streak. The spark was Microsoft’s Azure print.
So the question lands: Was this engineered to liquidate 3x positions? There is no public evidence of a single plot aimed only at retail SOXL holders. What did happen—and amplify both the slide and the bounce—are margin calls, forced selling, and daily leveraged-ETF rebalancing. This piece walks through that market plumbing. It is not a buy or sell recommendation.
At a glance — drawdown vs Thursday’s rebound
Put the numbers side by side. The same semiconductor narrative feels completely different in an unlevered ETF versus a 3x daily product.
- From the peak (approx.): SOXX −25% / SOXL −63% (from around the June 22 high)
- Gain needed to recover (approx.): SOXX +33% / SOXL +170% — choppy paths hurt SOXL more
- July 30: SOXX ~+8–8.5%; MU +15–18%; AMD +12–13%; SK Hynix ADR +15–17%; NVDA ~+2–3%
- Catalyst: MSFT ~+16% (Azure +43%, FY Azure $100B+). Meta −8–9% on FCF −91%
Bar chart of SOXX vs SOXL peak-to-trough decline. Approx. peak-to-trough from ~Jun 22. Compiled from multiple reports. Not advice.
What a 3x leveraged ETF actually is
A leveraged ETF trades like a stock but is built to deliver a daily multiple of an index’s return—three times, in SOXL’s case, versus a New York semiconductor benchmark. It is not a promise that semiconductors will return 3x over months.
Because cash equities alone rarely deliver that multiple cleanly, the manager uses swaps and futures. Reports put SOXL’s derivatives notional near half of net assets. Counterparties charge a spread over short-term rates (SOFR). That financing cost rarely appears as a neat fee line; it bleeds into daily performance.
A ~0.7% expense ratio therefore understates the economic cost of holding for weeks. Direxion’s own language is blunt: do not expect three times the cumulative index return for periods longer than a day.
Daily reset — why −25% became −63%
The fund resets every night. If the index falls 10% in a session, a 3x product targets about −30%. Shrink the asset base, and keeping 3x leverage means selling derivatives into weakness. A +10% bounce the next day only applies 3x to the smaller base. The index can be flat over two days while the leveraged share still sits lower.
Toy math: start at 100; −10% → 90; +11.11% → 100 again. The 3x path goes 70, then 70×1.333≈93.3. The index healed; leverage did not. That is volatility decay—or path dependence.
In a five-week, high-volatility slide, you can get something like the reported ~63% loss instead of a clean 3×25%=75%. In a smooth one-way rally, compounding can work in your favor. The product is not broken; it is a one-day tool held for many days.
-
1
Index falls that day
-
2
3x ETF loses a larger %
-
3
Smaller NAV → cut exposure (sell)
-
4
Next-day bounce is 3x on a smaller base
-
5
Index recovers; leverage still has a hole
Are forced liquidations and margin calls real?
Yes. They are just not the same story as ‘a cabal hunted retail SOXL.’ Different leverage layers stacked on the same tape.
A margin call is a broker or prime asking for more collateral when prices fall. Fail to meet it and you get forced liquidation—positions sold whether you like it or not. Hedge funds and retail credit accounts follow the same logic: contractual risk limits, often automated.
Late-July reporting described Goldman Sachs and JPMorgan pressing AI- and memory-heavy hedge funds for more collateral. Goldman commentary put roughly 16% of prime exposure in AI memory-related names as of June 30. Leopold Aschenbrenner’s Situational Awareness fund was reported cutting public equity positions to meet margin with BofA, Goldman, and JPMorgan.
JPMorgan’s Nikolaos Panigirtzoglou wrote Wednesday that tech/semi/memory deleveraging moved faster than expected, leaving limited room for more. Read that as evidence the unwind pressure ran hot—not as a guarantee that risk is gone.
Liquidation cascades — why ‘flush then bounce’ looks scripted
A liquidation cascade is forced selling that pushes price further, which triggers more forced selling. Leveraged ETFs cut exposure on down days; margin accounts breach ratios; clustered stop orders add fuel.
Korea showed a local version: single-stock 2x ETFs on Samsung and SK Hynix, with mechanical futures rebalancing near the close amplifying cash-index swings. That reads less like a hunt and more like product design amplifying volatility.
So a crash-then-spike can look like stop hunting. Often the sequence is simpler: (1) leverage shrinks for a while, (2) a real catalyst arrives, (3) short covering and up-day ETF rebalancing buy into strength. July 30 fits that mix.
-
1
Price falls
-
2
Margin calls, stops, ETF selling
-
3
Further decline
-
4
Leverage cut / news digested
-
5
Catalyst + short cover / up-day rebalance
-
6
Sharp rebound
Thursday’s rebound — Azure flipped the switch
The surface switch was fundamental. Microsoft printed $90.0B in quarterly sales and Azure growth of +43% in constant currency (vs ~40% expected). Fiscal-year Azure above $100B argued that AI spend was turning into revenue.
Meta fell on free cash flow down about 91% year over year and soft guidance. The market’s question was not ‘do you spend on AI?’ but does the spend show up in sales and profits? Microsoft passed; Meta did not. Chips tagged along with the pass.
Layer on the prior deleveraging: after leverage has already been cut, the same good news meets less forced selling and more mechanical buying. That is closer to an unwind clearing, then a catalyst landing than to a staged hunt of 3x retail.
Was the tech broken — demand vs equity leverage
A 20–25% price drop does not mean HBM suddenly flooded or CoWoS packaging eased. Most commentary still cites tight HBM into 2027 and strong sector earnings-growth estimates. This correction was more about AI CapEx ROI and valuation doubt than ‘chips are not selling.’
Separate two questions: supply-chain demand (industry) versus who was leveraged how many times (finance). Healthy industry plus excessive leverage still produces violent equity paths. After leverage is cut, the same earnings print can bounce faster.
Even into the slide, roughly $24.7B flowed into major semi ETFs (SOXX, SMH, DRAM, SOXL), including about $5.1B into SOXL. Forced selling and dip-buying coexisted. Chasing with daily 3x means accepting reset costs on purpose.
Stop-hunt folklore vs structure
‘Stop hunting’ usually means a big player pushes into stop clusters, liquidates weak hands, then reverses. Thin books can overshoot. A multi-week sector −20% and SOXL −60%, though, lines up better with repricing + institutional delever + ETF mechanics in the public record.
- Real: margin calls, forced sales, daily ETF sell/buy, stop and credit cascades
- Easy to overstate: a single plot aimed only at retail 3x holders
- Practical takeaway: hold a one-day 3x product for weeks and the path becomes your P&L
For context, see our earlier semiconductor selloff and bottleneck outlook, the Korea–global ETF tax and fee guide for product structure, and US market correction and DXY history for the broader tape.
Takeaways
The 20–30% semiconductor drawdown and the July 30 spike are not one-line ‘they hunted 3x.’ What showed up in reporting is hedge-fund/prime deleveraging, leveraged-ETF daily resets, and Microsoft’s Azure switch. That mix deepened the slide and steepened the bounce.
After a −63% SOXL drawdown, simple math already needs about +170% to break even—and a choppy recovery can demand more. Bullish on chips is not the same as holding a 3x daily fund.
One line: Leverage can be right on direction and still wrong on path. A green Thursday does not refund weeks of structural decay. This is market-structure education, not investment advice. Figures and headlines will keep updating.
Leverage can be right on direction and still wrong on the path — daily resets do not forgive chop.
Sources
- CNBC — Jul 30 market / JPM delever
- Yahoo Finance — leverage cost of chip crash
- TechTimes — SOXL −63% vs SOXX −25%
- Motley Fool — MSFT Azure / chip rebound
- Chosun Biz — Korea leveraged ETF whiplash
- Khan Capital — SOX bear market
- Internal: 2026-07-31-semi-leverage-liquidation-rebound-session-01.md
이 글은 정보 제공 목적이며, 특정 자산의 매수·매도를 권유하지 않습니다.
For information only — this is not a recommendation to buy or sell any asset.
댓글Comments 0