US Stock Market Correction — S&P Only 1% Off Highs: Where in History? (Views 1)
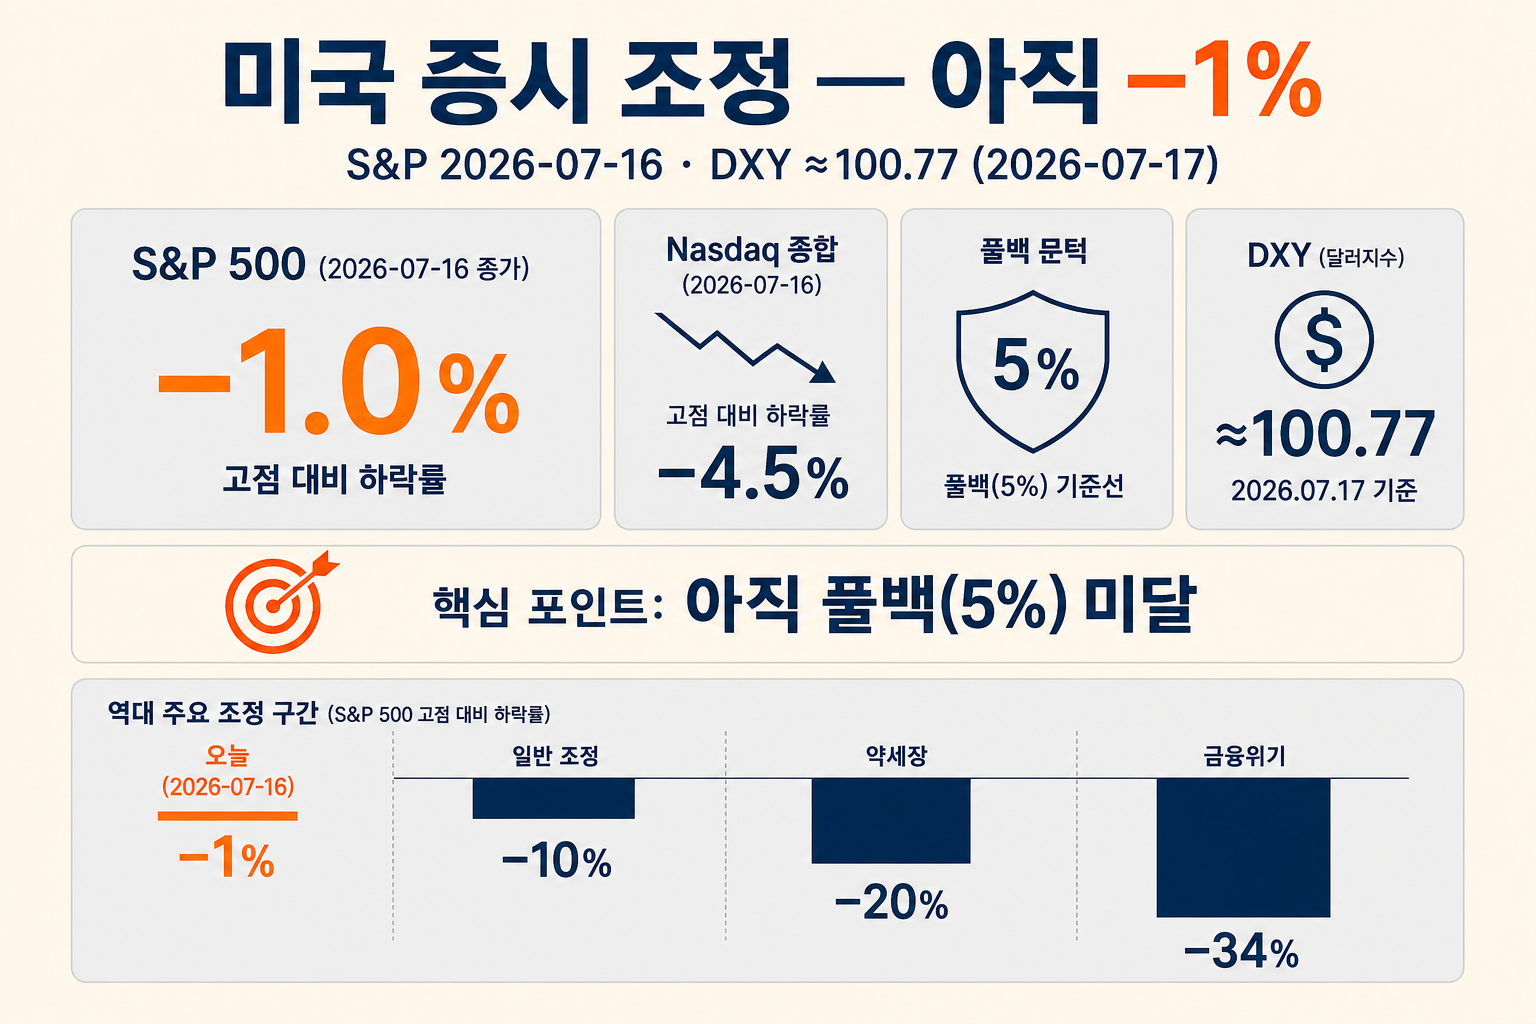
On the US stock market correction question: as of the 2026-07-16 close, the S&P 500 sits about 1.0% below its all-time closing high (7,609.78 on June 2) and Nasdaq about 4.5% below its high (27,093.90). By the usual industry labels, that is still a shallow dip—short of a ~5% pullback.
Yet when semiconductors drop more than 4% in a day, it feels like a real correction. Sensation and index math diverge. The same week, the DXY (US Dollar Index) hovered near 100.5–100.8, a bit soft versus its ~52-week high around 101.80.
This piece (1) defines pullback / correction / bear in plain numbers, (2) plugs in today’s levels, (3) tables drawdowns, durations, and recoveries from 2018–2022 and earlier, and (4) keeps near- and longer-term views as conditional if/then only. Not a buy or sell recommendation.
Pullback, correction, bear — split by the numbers first
“Correction” in headlines is not a legal term. For a big index like the S&P 500, industry and media roughly sort peak-to-trough declines like this:
- Pullback ≈ ~5% from the peak — short snapback language
- Correction ≈ ~10% — the threshold used in many research tables (e.g. Yardeni)
- Bear market ≈ ~20%+ — full bear-market language
Closing highs versus intraday highs can nudge the percentage a little. The compare block below puts the three buckets side by side.
Industry labels — 5% · 10% · 20%
ComparePullback ≈5%
Correction ≈10% / Bear ≈20%
Pullback 5% correction 10% bear 20% definition compare. Not legal definitions. Industry/media peak-to-trough labels (e.g. Yardeni). Close vs intraday highs can nudge %.
Where does today’s US market sit?
Close of 2026-07-16: S&P 500 at 7,533.77 (−0.51% on the day). Versus the closing ATH 7,609.78 that is −1.00%; versus the intraday high 7,620.90 it is −1.14%. Still well short of a 5% pullback.
Nasdaq Composite closed at 25,881.95 (−1.47%). Versus the closing ATH 27,093.90 that is about −4.47%—deeper than the S&P, but still under the ~5% pullback line and far from a 10% correction. The Dow (52,553.32) was cushioned by defensives such as healthcare.
VIX closed at 16.73 on July 16 and traded near 18 the next session. That is calm-to-mild caution—not the 80s of 2008 or 2020. It matches a shallow drawdown.
Now vs thresholds — % from peak
BarCurrent S&P 1% Nasdaq 4.5% vs historical drawdown bars. Current: 2026-07-16 close S&P −1.0% · Nasdaq −4.47%. Thresholds = industry labels (5/10/20). Not advice.
Why it feels big while the index is shallow — semis
The same day, S&P tech fell about −1.8% and semiconductors about −4.3% (SOXX, per reports). Some chip names printed −5% to −12%. That is why screens look red while the benchmark is only ~1% soft.
Chip weight inside the index used to be roughly ~8%; reports now put it in the 20%+ range. A few industries swing the index harder. Healthcare rose about +2.2% the same day. Index down ≠ every stock down.
Earnings paint another layer. LSEG expects S&P 500 Q2 EPS growth near +24.8% YoY and tech near +65.5%. TSMC can post +77% profit growth and still see the ADR −2%—strong prints ≠ higher prices when expectations and multiples are being digested. For chip supply/bottleneck context, see also our semiconductor selloff note.
Do DXY and stocks always move opposite?
DXY is a US Dollar Index—a score of the dollar versus a basket of major currencies. Around 100.77–100.79 as of 2026-07-17: roughly −0.08% month-over-month, +2.3% year-over-year, a bit soft versus the ~52-week high near 101.80.
Recently the picture is not the textbook “stocks↓ / dollar↑.” Equities are digesting a chip/AI rotation; the dollar softened as June CPI cooled and Fed hike bets faded. Both are mildly soft—the link is mixed, not locked one way.
History is regime-dependent. In March 2020, DXY spiked to an intraday ~102.82 while equities crashed (classic risk-off). In the 2022 hiking / strong-dollar regime, DXY’s September monthly print near 112 lined up with equity weakness. End-2018, DXY was nearer 96. Correlation changes with the regime.
Dollar & stocks — regime matters
CompareNow (Jul 2026)
2020 vs 2022
DXY vs stocks regime compare 2020 2022 now. DXY approx. Now ~100.7 (Jul 2026) · Mar 2020 intraday ~102.8 · Sep 2022 monthly ~112 · Dec 2018 ~96.2. No single long-run ρ.
Correction history — drawdown, days, recovery
Figures lean on Yardeni’s S&P 500 correction and bear tables: peak→trough %, days down, and (where cited) time back to prior/new highs. Put today’s −1% / −4.5% beside these rows and the “slight correction” question answers itself.
- Feb 2018: −10.2%, 13 days — short correction (Volmageddon-style)
- 2018 Q4: −19.8%, 95 days — near-bear. New high 2019-04-23 (~120 days from trough)
- COVID 2020: −33.9%, 33 days — fast crash. New high 2020-08-18 (~181 days from trough)
- 2022 bear: −25.4%, 282 days — prior-peak recovery roughly 12–15 months from trough (definitions vary)
- Aug 2015: −12.4%, 96 days / 2015–16: −13.3%, 100 days — mid-size corrections
- 2011: −19.4%, 157 days / 2010: −16.0%, 70 days
- GFC: −56.8%, 517 days — ATH back 2013-03-28 (~1,997 days from trough)
- Dot-com: −49.1%, 929 days — ATH back 2007-05-30 (~2,623 days from trough)
Bottom line: today’s S&P −1% does not clear even the smallest Yardeni correction row (−10%+). The “big correction” feeling comes from single-name and sector swings; at the benchmark level we are still below / at the door of a pullback.
Historical drawdowns — S&P peak→trough %
BarHistorical US correction drawdown bar chart 2018 2020 2022. Yardeni S&P correction/bear tables primary. Today −1% for scale. Days/recovery in body list. Not advice.
Recovery length also tracks the cause. 2020 was a liquidity/policy panic—new highs within ~half a year of the trough. 2000 and 2022 mixed valuation and tightening, so healing took longer. Do not treat past average recovery days as a promise for this cycle.
Near term — only as conditions (FOMC, earnings, oil)
The Fed funds target is 3.50–3.75% after the June 17, 2026 FOMC hold (12–0). Next meeting: July 28–29. June CPI printed +3.5% YoY (down from +4.2% in May) and −0.4% MoM; core +2.6%. July hike odds collapsed toward single digits / low teens depending on the snapshot.
The 10-year yield closed near 4.56% on July 16. For a wallet-level Fed frame, see also our Fed hold / wallet impact note. What follows is if/then, not a locked forecast.
- Base: July FOMC hold + earnings season without a chip blow-up → chop near highs / another try at peaks
- Downside: Middle East oil spike → inflation re-acceleration / September hike odds up + soft chip guidance → enter the 5–10% pullback/correction zone
- Upside risk to risk assets: further CPI cooling + geopolitics easing → softer real-rate pressure
Near term — three if/then lanes
FlowUS market near-term conditional scenario flow. Not a forecast or target. Inputs: July FOMC, CPI 3.5%, chip earnings, oil/geopolitics, VIX 16–18. Not advice.
Oil/geopolitics overlaps our oil, Iran, Hormuz piece. No price targets or allocation advice.
Longer horizon — why we won’t promise recovery length
Over a longer clock, real rates, growth, and megacap earnings durability drive multiples. A 2022-style strong-dollar / hiking path and a 2020-style liquidity surge produce different policy responses—and different healing times.
Some coverage read the June SEP / dot plot as “hold with a hike option” into year-end 2026. Treat that as what markets are pricing as a menu—not as “rates must rise / fall.” Past average recovery days are reference, not a contract for 2026.
Close — location check, not a trade signal
As of mid-July 2026, the US stock market correction at the index level is about −1% (S&P) and −4.5% (Nasdaq)—still under the 5% pullback threshold. DXY near 100.7 is mildly soft; VIX in the mid-teens is not crisis fear. Versus historical −10% / −20% / −30% episodes, today’s “slight correction” feel is closer to semiconductor day-to-day swings than to a full index correction.
Near- and longer-term paths split on FOMC, oil, chip guidance, and real rates. The numbers and tables here are for education and location-checking. Not investment advice; past recoveries do not guarantee the future.
One-line note: before saying “the correction is here,” write down the percent from the high. That habit aligns feeling with the tape.
Before saying the correction is here, write the percent from the high.
Sources
- Yardeni — S&P 500 Corrections & Bear Markets
- Straits Times / Reuters — Wall Street 2026-07-16
- Trading Economics — US Dollar Index (DXY)
- FRED — NASDAQ Composite
- Wikipedia — S&P 500 closing milestones
- BLS — CPI June 2026
- Federal Reserve — FOMC June 17, 2026
- YCharts — VIX
- FXStreet — DXY / Fed hike bets
- CBS/AP — S&P recovers 2018 high (2019-04-23)
미국 증시 조정 — S&P 고점 대비 1%, 역사에서 어디에? (조회수 1)
미국 증시 조정은 2026년 7월 16일 종가 기준, S&P 500이 역대 종가 고점(6월 2일 7,609.78) 대비 약 1.0%, Nasdaq은 고점(27,093.90) 대비 약 4.5% 아래에 있습니다. 업계에서 흔히 쓰는 기준으로 보면 아직 pullback(약 5%)에도 못 미친 얕은 되돌림입니다.
그런데 반도체 지수가 하루에 4% 넘게 빠지면 ‘조정이 왔다’는 느낌이 확 옵니다. 체감과 지수 숫자가 어긋나는 구간입니다. 같은 날 DXY(달러 인덱스)는 100.5~100.8 부근으로, 52주 고점(약 101.80)보다 살짝 약한 편입니다.
이 글에서는 (1) pullback·correction·bear를 숫자로 나누고, (2) 지금 위치를 대입하며, (3) 2018·2020·2022 등 역대 낙폭·기간·회복을 표로 보고, (4) 단기·장기는 조건이 맞을 때만 시나리오로 적습니다. 매수·매도 추천이 아닙니다.
풀백·조정·약세장 — 숫자로 먼저 나누기
뉴스에 나오는 ‘조정’은 법률 용어가 아닙니다. S&P 500처럼 큰 지수가 최근 고점 대비 얼마나 빠졌는지를 두고, 업계·미디어가 대략 이렇게 나눕니다.
- Pullback(풀백) ≈ 고점 대비 약 5% — 짧은 되돌림으로 부르는 구간
- Correction(조정) ≈ 고점 대비 약 10% — Yardeni 등 연구 표에서도 자주 쓰는 문턱
- Bear market(약세장) ≈ 고점 대비 약 20% 이상 — 본격 하락장으로 부르는 구간
종가 고점을 쓰느냐, 장중 고점을 쓰느냐에 따라 %는 조금 달라질 수 있습니다. 아래 비교는 그 세 칸을 한눈에 보여 줍니다.
업계 관례 — 5% · 10% · 20%
비교풀백 ≈5%
조정 ≈10% / 약세 ≈20%
풀백 5% 조정 10% 약세장 20% 정의 비교. 법적 정의 아님. S&P 고점 대비 낙폭 기준의 업계·미디어 관례(Yardeni 등). 종가/장중 고점에 따라 % 소폭 차이.
지금 미국 증시 조정은 어디에 있나
2026년 7월 16일 종가입니다. S&P 500은 7,533.77(하루 −0.51%). 역대 종가 고점 7,609.78 대비 −1.00%, 장중 고점 7,620.90 대비 −1.14%입니다. 5% 풀백 문턱까지는 아직 거리가 있습니다.
Nasdaq Composite는 25,881.95(하루 −1.47%). 종가 고점 27,093.90 대비 약 −4.47%로 S&P보다 깊습니다. 그래도 관례상 풀백(~5%) 바로 아래, 조정(10%)과는 한참 떨어져 있습니다. 다우(52,553.32)는 헬스케어 등 방어·실적주가 받쳐 상대적으로 덜 흔들렸습니다.
공포 지수 VIX는 7월 16일 종가 16.73, 다음날 장중 18대입니다. 2008·2020처럼 80대까지 치솟은 ‘공포 국면’이 아닙니다. 낙폭이 얕은 것과 맞습니다.
지금 vs 문턱 — 고점 대비 낙폭 %
막대현재 S&P 1% Nasdaq 4.5% vs 역사 조정 낙폭 막대. 현재: 2026-07-16 종가 기준 S&P −1.0% · Nasdaq −4.47%. 문턱은 업계 관례(5/10/20). 투자 권유 아님.
체감은 큰데 지수는 얕은 이유 — 반도체
같은 날 S&P 기술 섹터는 약 −1.8%, 반도체는 약 −4.3%(SOXX 기준 보도)였습니다. 개별 칩 종목은 −5~−12%까지 나온 날도 있습니다. 지수는 1%대인데 화면은 빨간불이 많은 이유입니다.
예전에는 지수 안에서 칩 비중이 대략 8%대였는데, 지금은 20%대가 넘는다는 보도가 나옵니다. 소수 업종이 지수 방향을 더 크게 흔듭니다. 동시에 헬스케어는 +2.2%처럼 오른 섹터도 있었습니다. 지수 하락 ≠ 전 종목 하락입니다.
실적 숫자만 보면 분위기는 또 다릅니다. LSEG 기준 S&P 500 2분기 주당순이익(EPS) 성장 전망은 전년 대비 약 +24.8%, 기술만 약 +65.5%입니다. TSMC 분기 이익이 +77%여도 ADR이 −2%대인 식의 ‘실적 호조 ≠ 주가 상승’이 겹칩니다. 기대치와 밸류에이션을 소화하는 구간으로 읽는 편이 맞습니다. 반도체 수급·병목 맥락은 반도체 매도·병목 전망 글과도 이어 볼 수 있습니다.
DXY와 주식은 항상 반대로 움직이나
DXY는 달러가 주요 통화 바구니에 비해 얼마나 강한지를 점수로 만든 달러 인덱스입니다. 2026년 7월 17일 기준 약 100.77~100.79. 전월 대비 약 −0.08%, 전년 대비 약 +2.3%. 52주 고점(약 101.80, 6월 24일 전후)보다는 살짝 약합니다.
최근 그림은 ‘주식↓·달러↑’ 교과서와는 조금 다릅니다. 증시는 칩·AI 회전으로 소폭 조정, 달러는 6월 CPI 둔화 뒤 연준 인상 베팅이 줄어들며 약세 쪽입니다. 둘 다 살짝한 쪽에 가깝고, 관계가 한 방향으로만 고정돼 있지 않습니다.
역사에서는 국면마다 달랐습니다. 2020년 3월 코로나 패닉에는 DXY가 장중 약 102.82까지 치솟으며 주식이 급락했습니다(안전자산 수요). 2022년 긴축·강달러 국면에는 DXY가 9월 월간 약 112 근처까지 가며 주식 약세와 같이 갔습니다. 2018년 말 조정 때는 연말 DXY가 약 96대였습니다. 상관관계는 그때그때 다릅니다.
달러·주식 — 국면마다 다르다
비교지금 (2026.7)
2020 vs 2022
DXY와 주식 레짐 비교 2020 2022 현재. DXY 근사치. 현재 ~100.7(2026-07) · 2020.3 장중 ~102.8 · 2022.9 월간 ~112 · 2018.12 월말 ~96.2. 단일 상관계수 주장 금지.
역대 미국 증시 조정 역사 — 낙폭·기간·회복
아래 숫자는 Yardeni Research의 S&P 500 조정·약세장 표를 우선으로 썼습니다. 고점→저점 낙폭(%), 걸린 날 수, (가능한 경우) 고점 회복 시점입니다. 지금 −1% / −4.5%와 나란히 보면 ‘약간의 조정’이 역사에서 어디인지가 바로 보입니다.
- 2018년 2월: −10.2%, 13일 — 짧은 correction(Volmageddon형)
- 2018년 4분기: −19.8%, 95일 — 약세장 직전. 2019-04-23 신고가(저점 후 약 120일)
- 2020년 코로나: −33.9%, 33일 — 빠른 폭락. 2020-08-18 신고가(저점 후 약 181일)
- 2022년 약세장: −25.4%, 282일 — 회복은 대략 저점 후 12~15개월 규모(정의에 따라 차이)
- 2015년 8월: −12.4%, 96일 / 2015–16: −13.3%, 100일 — 중간 크기 correction
- 2011년: −19.4%, 157일 / 2010년: −16.0%, 70일
- 금융위기(GFC): −56.8%, 517일 — 신고가 회복 2013-03-28(저점 후 약 1,997일)
- 닷컴: −49.1%, 929일 — 신고가 회복 2007-05-30(저점 후 약 2,623일)
한 줄로 요약하면, 지금 S&P −1%는 위 표의 최소 correction(−10%)에도 한참 못 미칩니다. ‘큰 조정’ 체감은 개별·섹터 변동에서 오고, 벤치마크 레벨로는 아직 풀백 초입~미만입니다.
역대 낙폭 비교 — S&P 고점→저점 %
막대역대 미국 증시 조정 낙폭 비교 막대 2018 2020 2022. Yardeni S&P Corrections & Bear Markets 표 우선. 지금 −1%는 비교용. 기간·회복은 본문 리스트. 투자 권유 아님.
회복 기간도 원인에 따라 갈립니다. 2020년은 유동성·정책이 빠르게 들어온 패닉형이라 저점 후 반년이면 신고가 근처로 갔습니다. 2000년·2022년은 밸류에이션·긴축이 겹친 쪽이라 회복이 길었습니다. 과거 평균 일수를 이번에도 약속으로 쓰면 안 됩니다.
단기 전망은 조건으로만 — FOMC·실적·유가
연준 기준금리는 2026년 6월 17일 FOMC에서 3.50–3.75%로 동결됐습니다(12–0). 다음 회의는 7월 28~29일입니다. 6월 CPI는 전년 대비 +3.5%(5월 +4.2%에서 둔화), 전월 대비 −0.4%. 핵심(식료·에너지 제외)은 +2.6%. 보도 시점마다 다르지만, 7월 인상 확률은 한 자리~10%대 전후로 크게 낮아진 상태입니다.
10년물 국채 수익률은 7월 16일 종가 부근 약 4.56%입니다. 금리·지갑 체감은 연준 동결·지갑 영향 글의 프레임과 맞춰 보면 읽기 쉽습니다. 아래는 확정 예측이 아니라 if/then입니다.
- 베이스: 7월 FOMC 동결 + 실적 시즌을 큰 충격 없이 통과하고 칩 급락이 진정되면 → 지수 고점 근처에서 횡보~재도전 가능
- 하방: 중동 긴장으로 유가↑ → 인플레 재가속·9월 인상 확률↑ + 칩 가이던스 실망 → 5~10% 풀백·조정 구간 진입
- 상방 리스크(위험자산에): 지정학 완화·CPI 추가 둔화로 실질금리 압력이 더 풀리면 → 위험자산 심리에 도움
단기 — 조건부 세 갈래
흐름도미국 증시 단기 조건부 시나리오 흐름도. 확정 예측·목표가 아님. 재료: 7월 FOMC·CPI 3.5%·칩 실적·유가/지정학·VIX 16~18. 투자 권유 아님.
유가·지정학 변수는 유가·이란·호르무즈 글과도 겹칩니다. 목표가·비중 추천은 없습니다.
장기 시나리오 — 회복 기간을 약속하지 않는 이유
긴 시계에서는 실질금리, 성장, 빅테크 이익이 얼마나 버티는지가 주가 배수(valuation multiple)를 좌우합니다. 2022형(강달러+긴축)과 2020형(유동성 급증)은 정책 반응이 달라, 회복에 걸리는 시간도 달랐습니다.
닷플롯·SEP에서 2026 연말 금리 경로가 ‘동결 + 인상 옵션’으로 읽힌 보도도 있었습니다. 그건 ‘앞으로 반드시 오른다/내린다’가 아니라, 시장이 어떤 선택지를 가격에 넣고 있는가를 보는 재료입니다. 과거 회복 일수 평균을 이번 경로의 약속으로 쓰지 않는 것이 안전합니다.
마무리 — 위치 확인용 숫자, 매매 신호 아님
정리하면, 2026년 7월 중순 미국 증시 조정은 지수로는 S&P 약 −1%, Nasdaq 약 −4.5%로 아직 5% 풀백 문턱 아래입니다. DXY는 100.7 전후에서 소폭 약세이고, VIX는 16~18대로 공포 국면이 아닙니다. 역대 −10%·−20%·−30%대 에피소드와 비교하면 ‘약간의 조정’ 체감은 반도체 일간 변동에서 오는 쪽에 가깝습니다.
단기·장기는 FOMC·유가·칩 가이던스·실질금리 조건을 따라 갈라집니다. 이 글의 숫자와 표는 지금 어디쯤인지 확인하는 교육·정보용입니다. 투자 권유가 아니며, 과거 회복이 미래를 보장하지 않습니다.
한줄 코멘트. ‘조정이 왔다’는 말보다, 고점 대비 몇 %인지부터 적는 습관이 체감과 현실을 맞춰 줍니다.
‘조정이 왔다’보다, 고점 대비 몇 %인지부터 적는 습관이 체감과 현실을 맞춰 줍니다.
출처
- Yardeni — S&P 500 Corrections & Bear Markets
- Straits Times / Reuters — Wall Street 2026-07-16
- Trading Economics — US Dollar Index (DXY)
- FRED — NASDAQ Composite
- Wikipedia — S&P 500 closing milestones
- BLS — CPI June 2026
- Federal Reserve — FOMC June 17, 2026
- YCharts — VIX
- FXStreet — DXY / Fed hike bets
- CBS/AP — S&P recovers 2018 high (2019-04-23)
답글 남기기