SME Microbusiness Share 45.9% of Jobs — No Official GDP Slice, ₩3.5T Startup Budget, What in the AI Era? (Views 1)

Korea’s microbusiness (소상공인) employment share was 45.9% in 2023 — about 10.90 million workers (exactly 10,899,947). The same year they accounted for 7,906,861 firms, or 95.2% of all enterprises. Headcount dominance, thin jobs per shop.
One honest caveat first. The national accounts do not publish an official GDP % for microbusinesses alone. Headlines that invent a neat “X% of GDP” overstate what the current system measures. What we do measure firmly: establishments, employment, SME-wide sales, and manufacturing value-added slices.
Still, 2026 startup-support budgets sit near ₩3.4645 trillion, and microbusiness-related outlays are reported near ₩5.4 trillion. This piece (1) untangles definitions, (2) splits policy effects by survival/sales proxies—not black-and-white ROI, (3) links the 0.8% self-employed unemployment-insurance take-up to psychological security, and (4) runs a conditional five-step post-AI path. Not investment or policy advice.
Microbusiness, SME, self-employed, startups — why the numbers disagree
Under Korea’s Micro-Enterprise Act, a microbusiness is a small enterprise that also meets headcount caps: under 10 regular employees in mining/manufacturing/construction/transport, under 5 elsewhere. “Small enterprise” itself is an industry-specific average annual sales test. Sales alone without the headcount cap does not qualify.
SMEs are the broader set (small + medium). End-2023: 8.299 million firms (99.9%), 19.118 million workers (80.4%), ₩3,301.3 trillion in sales (44.9% of all sales). Microbusinesses sit inside SMEs — they are not synonyms.
Self-employment is a labour-force status. Korea’s self-employed share of employment was about 23.2% in 2023 — above OECD citations near 15.6–17%. That is not the legal microbusiness count. Startup firms mean age ≤ 7 years (4.902 million in 2023).
Even “microbusiness” splits by survey. MSS enterprise-status stats show ~7.91 million firms in 2023; the microbusiness census sample shows 6.134 million in 2024. Different frames, both usable — not one merged figure. The diagram maps the vocabulary.
Four vocab lanes — don’t mix
CompareMicrobusiness
SME / SE / Startup
Compare microbusiness SME self-employed startup definitions. Legal microbusiness ≠ self-employment status ≠ startups (≤7y) ≠ all SMEs. Survey 6.13M vs status 7.91M = frame difference.
Employment share — the real national weight
Official 2023 all-industry (1+ persons) figures: microbusiness firms 7,906,861 (95.2%), workers 10,899,947 (45.9%) of 8,309,696 firms and 23,767,377 workers (MSS SME status tables).
The gap between ~95% of firms and ~46% of jobs is the story. Many shops, few jobs each. The 2024 survey puts average workers per firm at 1.57 (1.60 prior year). Headcount economy ≠ value-added economy on the same scale.
Headcount vs jobs — microbusiness share
BarMicrobusiness jobs 45.9% firms 95.2% bar chart. 2023 all-industry (1+) MSS SME status. Firms 95.2% · workers 45.9%. No official GDP % slice.
Sectors skew livelihood/domestic-demand: 2024 survey — wholesale/retail 2.10 million firms (34.2%) and 3.039 million workers; real estate 862k; lodging/food 796k; construction 568k; manufacturing 537k. When alley demand wobbles, national employment can wobble with it.
Value-added needs care. Manufacturing (10+ persons) SME value-added share was 36.9% in 2023 (₩246.9T / ₩669.6T manufacturing VA). That is manufacturing SMEs, not a microbusiness GDP line. Bank of Korea 2024 nominal GDP was ₩2,556.9T (real +2.0%). Slicing microbusiness out of that requires a satellite account or custom estimate — neither is an official published %.
Bottom line: weight is clearly large in jobs and establishments, and still officially blank as GDP %.
State-led startup support — large budgets, effects by lane
The 2026 central/local startup-support consolidated notice totals ₩3.4645T (+₩170.5B / +5.2% vs ₩3.294T in 2025). 111 agencies, 508 programmes. Mix: loans/guarantees ₩1.4245T (41.1%), R&D ₩864.8B (25.0%), commercialization ₩815.1B (23.5%). MSS holds 93.9% of central ministry outlays (₩3.0734T). Youth entrepreneurship: ₩257.5B (+₩80.1B).
Microbusiness budgets run on a parallel track: ~₩5.4T reported for 2026; programme budget ₩1.341T (+64%); policy finance ₩3.362T. Safety-net/rechallenge ₩930.6B includes a management-stability voucher ₩579.0B (~2.3 million firms under ₩104M annual sales, ₩250k each) and Hope Return Package ₩305.6B (+₩60.6B). Scale-up “startup” money and livelihood “hold on / exit” money share one budget book.
Does it “work”? Split visible proxies from missing fiscal ROI. National Data Agency 2024 firm birth-death (provisional): new firms 922k (−3.5%, lowest since 2017), birth rate 12.1% (series low). 1-year survival 64.4% (−0.5pp); 5-year survival (2018 cohort) 36.4% (+1.6pp, near a record high). Budgets up, births down — scoring policy only by “doors opened” misreads the system.
Survival proxies — general vs past support
BarFive-year survival 36.4% vs supported firms historical 53.1%. General 5y survival 36.4% (2018 cohort). Past supported 53.1% vs then-general 28.5% (2017 release; era/sample differ). Not fiscal ROI. Selection bias.
Past KISED comparisons show a survival premium: supported firms ~53.1% five-year survival (2017-based release) vs general 28.5% then. Era and sample differ; selection bias is hard to remove. Standard time series of fiscal ROI (tax/VA return per won spent) are not published in a standardised form.
Latest proxies point both ways. KISED 2025 performance survey (85,265 supported firms): 2024 average jobs 8.97 (−10.4% YoY), average sales ₩1.775B (+20%). Jobs down, sales up can mean productivity — or weaker job contribution. Better to score lanes than invent a single grade.
- Clearer effects: historical survival premium for supported firms; +20% sales among supported firms; short-run cash buffers from vouchers/rechallenge
- Ambiguous/weak: birth counts/rates near lows; falling average headcount at supported firms; official fiscal ROI gap
- Caveat: survival premium ≠ pure policy causality — selected teams may live longer anyway
Where policy shows — lane grades
Tier boardStartup policy effect lanes tier board survival sales ROI. Interpretive lanes from research. S=clear proxy / A=partial / B=mixed or reverse / C=official blank. No fiscal ROI series. Not advice.
Psychological security — the 0.8% unemployment-insurance blank
Unemployment insurance is the main buffer against income shocks. End-2024, among 6,747,159 individual business owners (<50 employees), only 53,705 self-employed kept UI coverage — 0.8% take-up (National Assembly Research Service via press). MOEL notes rising new enrolments in 2025 Q1, but the stock remains under 1%.
Survey motives for starting: “run my own shop” 65.7%, “income” 18.1%, “hard to find wage work” 15.8% — a non-trivial involuntary inflow. Pain points (multi-response): intensifying competition 61.0%, input costs 49.6%, declining catchment 33.5%. A large self-employed/microbusiness sector is both a labour buffer and, with thin social insurance, a vulnerability zone.
Vouchers and Hope Return packages exist for that reason. Cheering entrepreneurship does not automatically buy psychological safety — people need a path to stand up after failure. The 0.8% figure is why state-led startup promotion does not auto-translate into national calm. For solo-scale revenue ladders, see also our Korea solo-entrepreneur ₩100bn path piece.
Post-AI — a conditional five-step path
Skip the hype. OECD (2025) puts Korean SME AI adoption near 31% (vs Germany ~51%). With SME employment in the 80% range, the adoption gap can transmit to jobs and productivity. Of SMEs that faced labour shortages (37%), 27% said generative AI helped fill gaps. The main channel is task/skill recomposition and shortage relief — not mass alley automation overnight.
On the street, many firms are still pre-AI. Survey digital/smart-tech use: 27.2% (+9.2pp YoY) — online channels 49.0%, store ops 34.4%, management software 19.6%, smart ordering/payments 15.2%. The steps below are a conditional scenario pointed to by data and budget mix — not a forecast already locked in.
Step 1 — Quantitative startup signals weaken. Births down, birth rate at a series low; exits 791k in 2023 (+5.3%). Opening more doors alone does not auto-raise employment or value added. Over-entry pressure is visible.
Step 2 — Dual budget tracks harden. ~₩3.5T startup (loan/R&D/commercialization) sits beside ~₩5.4T microbusiness (finance/vouchers/rechallenge). Scale-up and livelihood safety nets share one table; which KPI wins remains a political-administrative choice.
Step 3 — Basic digital, then generative-AI tools. 31% AI / 27% digital use implies channels, payments, and ops still come first. Without tool diffusion, the gap widens. “AI erases the alley” fits the data less well than “users vs non-users diverge.”
Step 4 — Reskilling/job transition plus income-based safety nets. OECD: among SMEs that faced skill shortages, 47% said genAI helped — paired with 0.8% UI take-up. Without a psychological buffer, state-led entrepreneurship can relocate anxiety instead of relieving it.
Step 5 — Conditional pivot to productivity / scale-up KPIs. If sales↑ and headcount↓ among supported firms persists, policy pressure shifts from “startup counts” toward survival, sales, digital use, and rechallenge quality. Macro softness can also echo layered recoveries like those mapped in our China K-shaped economy note — as an observation axis, not a locked prediction.
Post-AI shift — conditional 5 steps
FlowPost-AI microbusiness policy conditional five-step flow. Not a locked forecast. Orders OECD SME AI ~31%, survey digital 27.2%, births↓, dual budgets, UI 0.8%.
Wrap-up — big footprint, thin buffer, conditional AI shift
A 45.9% employment share and 95.2% firm share mean a wide national footprint. GDP % remains officially blank; startup and microbusiness budgets run in the trillions of won. Effects show more in survival/sales proxies than in birth counts, fiscal ROI, or average headcount.
Psychological security comes from UI, rechallenge paths, and digital tools moving together — not from cheerleading alone. AI shows up first as a user/non-user gap filling labour shortages, not as a single alley wipeout. Sources: MSS, National Data Agency, BoK, OECD, NARS via press. Not investment or policy advice.
Headcount can be half the jobs — and still have no official GDP slice.
Sources
소상공인 고용 비중 45.9% — GDP엔 없고 창업지원은 3.5조, AI 시대는? (조회수 1)
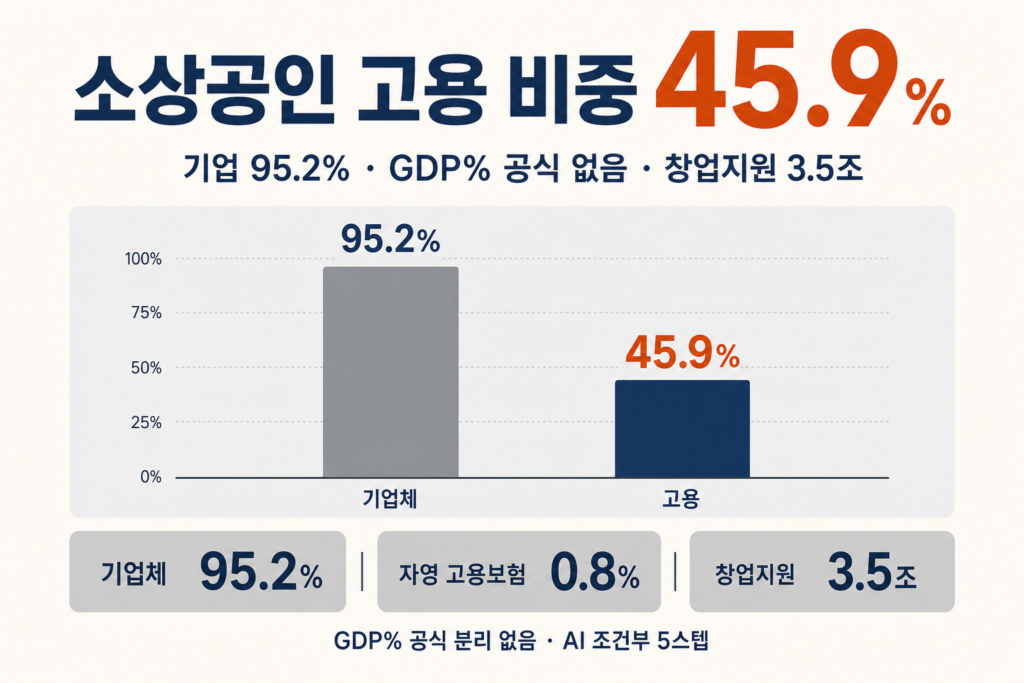
소상공인 고용 비중은 2023년 기준 45.9%입니다. 종사자 약 1,090만 명(정확히는 10,899,947명), 전체 종사자의 절반에 가깝습니다. 같은 해 소상공인 기업체는 790만 6,861개로 전체 기업의 95.2%입니다. 가게(사업체) 수는 아주 많은데, 한 곳당 일하는 사람은 적다는 뜻입니다.
한 가지를 먼저 정직하게 말하겠습니다. 국민계정은 소상공인만 따로 떼어 GDP 기여 ○○%를 공식으로 내놓지 않습니다. ‘소상공인이 GDP의 몇 퍼센트’라는 헤드라인은, 지금 체계로는 단정할 수 없습니다. 측정되는 쪽은 사업체·고용·매출(중소 전체)·제조 부가가치의 일부입니다.
그럼에도 정부는 2026년 창업지원만 약 3조 4,645억, 소상공인 관련은 보도 기준 약 5.4조를 움직입니다. 이 글에서는 (1) 정의와 숫자 혼동을 정리하고, (2) 예산·생존율로 ‘효과가 있는 곳’을 나누며, (3) 자영업 고용보험 가입률 0.8%가 심리 안정감과 어떻게 붙는지, (4) 대AI 시대에 이 구조가 어떻게 풀릴지 조건부 5스텝으로 봅니다. 투자·정책 권유가 아닙니다.
소상공인·중소·자영·창업 — 뉴스 숫자가 안 맞는 이유
소상공인은 「소상공인기본법」상 소기업이면서, 상시근로자 요건을 동시에 충족한 사업자입니다. 광업·제조·건설·운수는 10명 미만, 그 외 업종은 5명 미만입니다. 소기업 자체는 업종별 평균(연간) 매출액 기준이고요. 매출만 맞아도 상시근로가 넘치면 소상공인이 아닙니다.
여기에 섞여 나오는 다른 말이 있습니다. 중소기업은 소기업+중기업 전체입니다. 2023년 말 829.9만 개(전체의 99.9%), 종사자 1,911.8만(80.4%), 매출 3,301.3조(전체 매출의 44.9%). 소상공인은 그 안의 하위 집합이지, ‘중소 = 소상공인’이 아닙니다.
자영업은 경제활동인구조사 같은 고용통계의 종사상지위입니다. 한국 취업자 대비 자영업 비율은 2023년 약 23.2%로, OECD 인용치(약 15.6~17%대)보다 높습니다. 법적 소상공인과 숫자가 다릅니다. 창업기업은 개시 후 7년 이내 기업(2023년 490.2만 개)이고요.
같은 ‘소상공인’ 안에서도 조사가 갈립니다. 중기부 중소기업위상(기본통계)은 2023년 기업체 790만대, 실태조사는 2024년 613만 4천입니다. 표본·범위가 달라서 둘 다 ‘맞고’, 한 줄로 합치면 틀어집니다. 아래 비교는 그 차표입니다.
용어 네 갈래 — 섞지 않기
비교소상공인
중소·자영·창업
소상공인 중소기업 자영업 창업기업 정의 비교. 법적 소상공인 ≠ 자영업 지위 ≠ 창업기업(≤7년) ≠ 중소 전체. 실태 613만 vs 기본통계 790만은 조사 범위 차이.
소상공인 고용 비중 — 국가경제에서 진짜 무게
다시 공식표입니다. 2023년 전산업(1인 이상) 기준, 소상공인 기업체 7,906,861개(95.2%), 종사자 10,899,947명(45.9%). 전체 기업 830만 9,696개, 전체 종사자 2,376만 7,377명입니다(중기부 중소기업위상).
기업 비중 95%대와 고용 비중 46%대의 간격이 핵심입니다. 가게는 많은데, 한 가게가 만드는 일자리는 많지 않습니다. 2024년 실태조사에서도 기업당 평균 종사자는 1.57명(전년 1.60)입니다. 그래서 ‘가게가 많다’와 ‘부가가치·생산성이 크다’를 같은 숫자로 보면 어긋납니다.
사업체 수 vs 일자리 — 소상공인 비중
막대소상공인 고용 비중 45.9% 기업체 비중 95.2% 막대. 2023년 전산업(1인 이상) 중기부 중소기업위상. 기업체 95.2% · 종사자(고용) 45.9%. GDP%는 공식 분리 없음.
업종도 생계·내수 쪽에 쏠립니다. 실태조사 2024년: 도소매 210만 개(34.2%)·종사자 303.9만, 부동산 86.2만, 숙박·음식 79.6만, 건설 56.8만, 제조 53.7만. 골목과 내수 수요가 흔들리면 국가 고용 통계도 같이 흔들릴 수 있는 구조입니다.
부가가치는 더 조심스럽습니다. 제조업(10인 이상)에서 중소기업 부가가치 비중은 2023년 36.9%(246.9조 / 제조 부가가치 669.6조)입니다. 이건 ‘제조 중소’ 이야기이지, 소상공인 단독 GDP가 아닙니다. 한국은행 기준 2024년 명목 GDP는 2,556.9조(실질 +2.0%)인데, 소상공인을 그중 %로 환산하려면 위성계정·별도 추정이 필요합니다. 지금은 그 공식 슬라이스가 없습니다.
정리하면, 소상공인이 국가경제에 미치는 무게는 고용·사업체 수로 분명히 크고, GDP%로는 아직 공식 측정이 비어 있다는 문장이 가장 정확합니다.
국가주도 창업 육성 — 예산은 크고, 효과는 ‘어디에’가 질문
2026년 중앙·지자체 창업지원 통합공고 예산은 3조 4,645억입니다. 전년 3조 2,940억 대비 +1,705억(+5.2%). 111개 기관·508개 사업. 유형별로는 융자·보증 1조 4,245억(41.1%), R&D 8,648억(25.0%), 사업화 8,151억(23.5%). 중기부 몫이 중앙부처 예산의 93.9%(3조 734억)입니다. 청년창업은 2,575억(+801억).
소상공인 쪽은 성격이 조금 다릅니다. 2026년 관련 예산은 보도 기준 약 5.4조. 지원사업 1조 3,410억(+64%), 정책자금 3조 3,620억. 안전망·재도전 9,306억 안에는 경영안정바우처 5,790억(연매출 1.04억 미만·약 230만 개사·가게당 25만원), 희망리턴패키지 3,056억(+606억)이 들어 있습니다. 스케일업용 ‘창업’과 생계형 ‘버티기·퇴로’가 같은 예산집에 공존합니다.
그럼 효과는 있나요? ‘있다/없다’로 자르기보다, 바로 보이는 숫자(생존율·매출)와, 공개되지 않은 재정 수익률(ROI)을 나눠 봅니다. 국가데이터처 2024년 기업생멸(잠정): 신생기업 92.2만(−3.5%, 2017년 이후 최저 수준), 신생률 12.1%(통계 작성 이래 최저). 1년 생존율 64.4%(−0.5%p), 5년 생존율(2018년생) 36.4%(+1.6%p, 역대 최고권). 예산은 늘고 신생은 줄었습니다, ‘문 여는 수’만으로 정책을 채점하면 해석이 왜곡됩니다.
생존율 비교 — 일반 vs 과거 지원
막대신생기업 5년 생존율 36.4% 지원기업 과거 53.1% 비교. 일반 5년 생존 36.4%(’18년생·국가데이터처 ’24). 과거 지원기업 53.1% vs 당시 일반 28.5%(’17 기준 발표·시대·표본 상이). ROI 직결 아님. 선택편의 주의.
지원기업의 과거 발표를 보면, 생존 프리미엄은 반복 관측됩니다. 창업진흥원 쪽 과거(2017년 기준) 지원기업 5년 생존율 53.1% vs 당시 일반 28.5%. 다만 시대·표본이 다르고, 선택편의(이미 살 만한 팀이 지원을 더 받는 편향)를 빼기 어렵습니다. 재정투입 대비 조세·부가가치 환원의 표준 ROI 시계열은 공개·표준화돼 있지 않습니다.
최신 지표도 한 방향으로만 가지 않습니다. 창진원 2025년 이력·성과조사(지원기업 85,265곳): 2024년 기업당 평균 고용 8.97명(−10.4% YoY), 평균 매출 17.75억(+20%). 고용이 줄고 매출이 는 구간은 ‘생산성’일 수도, ‘일자리 기여 약화’일 수도 있습니다. 흑백 점수 대신 영역을 나눠 보면 이렇습니다.
- 상대적으로 보이기 쉬운 효과: 지원기업 생존율 프리미엄(과거 비교), 지원기업 매출 성장(+20%), 단기 바우처·재도전 패키지의 현금 버팀목
- 애매하거나 약한 축: 신생 수·신생률(역대 저점 근처), 지원기업 평균 고용 역성장, 재정 ROI의 공식 공백
- 해석 주의: 생존 프리미엄 ≠ 정책만이 만든 성과. 선발된 팀이 더 오래 살 수 있음
정책 효과는 어디에 — 영역별 채점
티어표창업지원 정책 효과 영역 티어표 생존 매출 ROI. 연구 재료 기반 해석. S=눈에 띄는 숫자 / A=부분만 관측 / B=애매·역신호 / C=공식 수치 없음. 재정 수익률(ROI) 공식 시계열 없음. 투자·정책 권유 아님.
국민 심리 안정감 — 고용보험 0.8%의 빈칸
고용보험은 실직·소득 단절이 왔을 때 버티게 해 주는 사회보험입니다. 그런데 2024년 말 개인사업자(50인 미만 기준) 674만 7,159명 중 자영업자 고용보험 유지 가입은 5만 3,705명 — 가입률 0.8%입니다(국회입법조사처 인용 보도). 고용부는 2025년 1분기 신규 가입이 늘었다고 하지만, 전체는 여전히 1% 미만입니다.
실태조사의 창업 동기를 보면, ‘직접 경영’ 65.7%, ‘수입’ 18.1%, ‘임금취업 어려움’ 15.8%입니다. 비자발에 가까운 유입이 적지 않습니다. 애로(복수응답)는 경쟁 심화 61.0%, 원재료비 49.6%, 상권 쇠퇴 33.5%. 자영업·소상공인이 많으면 일자리를 막는 데도 도움이 되지만, 보험 같은 안전망이 약하면 충격에 더 쉽게 흔들립니다.
정부가 바우처·희망리턴을 늘리는 이유도 여기에 가깝습니다. 창업을 ‘장려’만 하면 심리가 안정되는 게 아니라, 실패해도 다시 설 장치가 있어야 불안이 덜해집니다. 가입률 0.8%는 ‘국가주도 창업’이 국민 심리 안전망으로 자동 전환되지 않는다는 숫자입니다. 1인·소규모 창업의 매출 사다리는 한국 1인 창조기업·100억 경로 글과도 이어 읽을 수 있습니다.
대AI 시대 — 조건부 5스텝으로 보는 흐름
과장부터 걷겠습니다. OECD(2025)는 한국의 SME AI 도입률을 약 31%로 봅니다(독일 약 51% 등 대비 낮음). SME 고용 비중은 80%대라, 도입 격차가 고용·생산성에 크게 전이될 수 있습니다. 인력난을 겪은 SME 37% 중 27%는 생성형 AI가 인력 부족을 보완한다고 답했습니다. 주 경로는 ‘대규모 일자리 소멸’보다 직무·스킬 재구성·인력난 보완입니다.
골목 현장은 아직 AI 전 단계가 많습니다. 실태조사 디지털·스마트 기술 활용 27.2%(+9.2%p YoY). 온라인 판로 49.0%, 매장관리 34.4%, 경영 SW 19.6%, 스마트 주문·결제 15.2%. 그래서 아래 스텝은 ‘이미 일어난 미래’가 아니라, 데이터와 예산 방향이 가리키는 조건부 시나리오입니다.
1스텝 — 양적 창업 신호 약화. 신생↓·신생률 최저, 소멸은 2023년 79.1만(+5.3%). ‘문을 더 열자’만으로는 고용·부가가치가 자동으로 안 늘어납니다. 과잉진입 압력이 드러난 구간입니다.
2스텝 — 예산이 두 갈래로 이어진다. 창업 3.5조(융자·R&D·사업화)와 소상공인 5.4조(자금·바우처·재도전)가 병행됩니다. 스케일업과 생계 안전망이 한 바구니에 같이 실립니다. 어느 쪽 KPI가 우선인지는 여전히 정치·행정의 선택입니다.
3스텝 — 기초 디지털 → 생성AI 도구. 도입률 31%·현장 디지털 27%는 ‘AI 전에 채널·결제·관리’가 먼저라는 뜻입니다. 도구 보급이 없으면 격차만 벌립니다. ‘AI가 골목을 없앤다’보다 ‘쓰는 사업자와 못 쓰는 사업자의 격차’가 데이터와 더 맞습니다.
4스텝 — 재교육·직무전환 + 소득기반 안전망. 생성AI가 스킬 부족을 돕는다는 응답(OECD: 스킬 부족 경험 SME의 47%)과, 가입률 0.8%는 한 세트입니다. 자동화·경쟁 쇼크에 심리적 버퍼가 없으면, 국가주도 창업 장려는 불안을 줄이기보다 불안을 이전할 수 있습니다.
5스텝 — 생산성·스케일업 KPI로 중심 이동(조건부). 지원기업 매출↑·고용↓ 같은 신호가 이어지면, 정책은 ‘창업 건수’보다 생존·매출·디지털 활용·재도전 품질로 옮겨갈 압력이 큽니다. 거시적으로는 내수·고용이 흔들릴 때 중국형 K자 회복처럼 계층별 온도차가 국내에도 겹쳐 보일 수 있습니다. 확정 예측이 아니라 관찰 축입니다.
대AI 전환 — 조건부 5스텝
흐름도대AI 시대 소상공인 정책 조건부 5스텝 흐름도. 확정 예측 아님. OECD SME AI~31%·실태 디지털 27.2%·신생↓·예산 두 갈래·가입률 0.8%를 순서에 맞춘 시나리오.
마무리 — 가게는 많고, 안전망은 얇고, AI는 조건부
소상공인 고용 비중 45.9%와 사업체 95.2%는, 나라 경제에서 차지하는 자리가 크다는 뜻입니다. GDP%는 공식으로 비어 있고, 창업·소상공인 예산은 조 단위입니다. 효과는 생존율·매출 같은 숫자에는 보이고, 새로 여는 가게 수·재정 수익률·평균 고용에는 그대로 보이지 않습니다.
심리 안정감은 창업 장려 구호가 아니라, 고용보험 0.8%·재도전·디지털 도구가 함께 움직일 때 이야기가 됩니다. AI는 골목을 한꺼번에 지우는 서사보다, 인력난을 메우는 쪽과 못 따라가는 쪽의 격차로 먼저 나타납니다. 숫자는 중기부·국가데이터처·한은·OECD·입법조사처 인용입니다. 투자·정책 권유가 아닙니다.
고용은 절반인데 GDP%는 비어 있다 — 무게와 측정이 어긋난 바닥면적.
답글 남기기