China housing and consumption — the limits behind the 40% figure
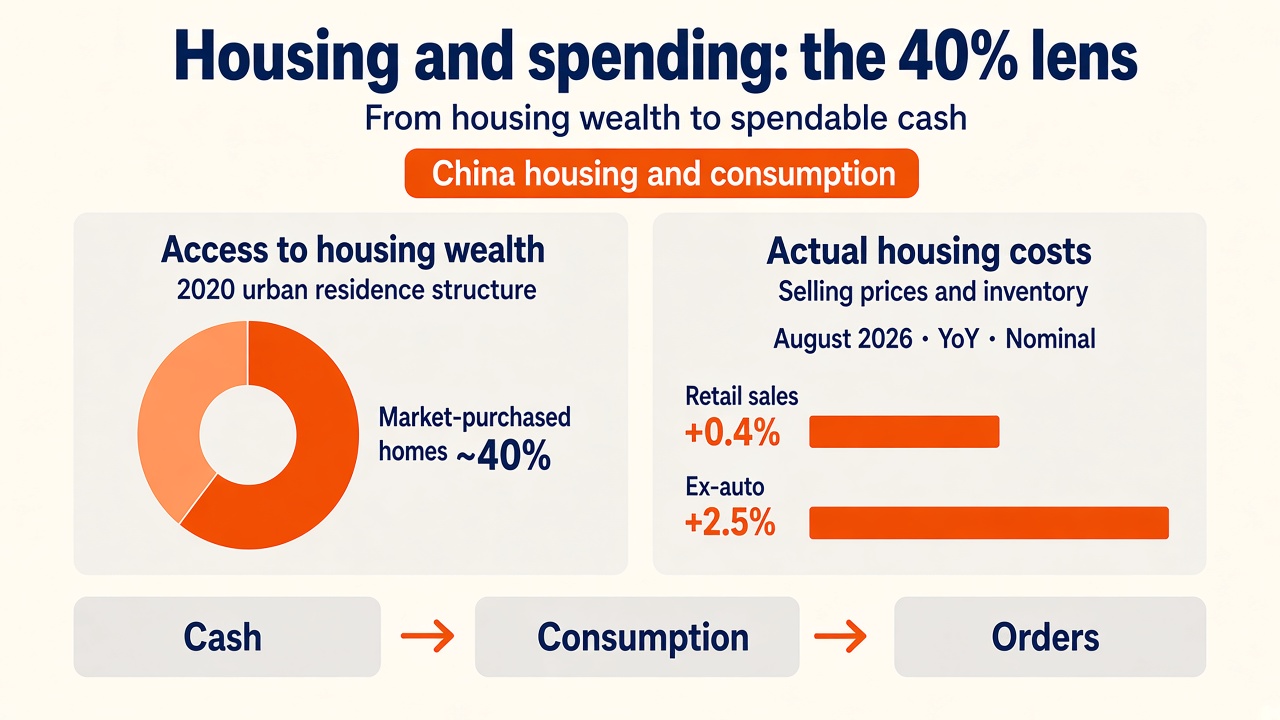
China housing and consumption cannot be understood through property prices alone. An IMF working paper released on September 18 puts market-purchased homes at about 40% of occupied urban dwellings. The distinction offers a useful starting point for thinking about household spending and Korean companies selling into China.
The share describes the 2020 census, not a fresh 2026 survey. The paper distinguishes market buyers, renters and owners who acquired homes outside the market, such as through inheritance or discounted public-housing sales. Consumption patterns differ after controlling for income and wealth, but the evidence does not establish causality. IMF paper
The business and policy discussion below is our interpretation. Supporting asset prices and increasing the cash a household can spend this month are different interventions. Treating them as interchangeable can produce overly optimistic earnings assumptions for consumer companies.
China housing and consumption: start with the latest sales
China’s consumer-goods retail sales grew 0.4% from a year earlier in August 2026. Excluding automobiles, growth was 2.5%. The automobile category therefore matters when interpreting the headline. NBS detailed release
August retail sales: the automobile difference. Source: NBS, August 2026. Nominal growth. Overlapping series, not growth contributions.
Both are nominal growth rates, without a price adjustment. The measure includes goods and catering, rather than all services. We checked the 0.4% headline against the September 15 overview; this is consistency checking within the official statistical system, not an independent replication.
These figures do not prove that housing caused weak spending. Purchase timing, discounts and the comparison base can all matter. Current sales data tell us what is happening; household balance sheets help us ask why different customers might respond differently to the same economic news.
A home is not a bank balance
Consider a household whose home has risen in value but which still needs to live there. Selling releases cash, yet replacement accommodation costs money. Unless the family downsizes or borrows, the entire capital gain is not available for everyday purchases. Feeling wealthier and having money available are separate conditions.
Liquidity means being able to turn an asset into cash without a large loss. Two homes with similar estimated values can provide different financial flexibility if one is hard to sell. A cash-constrained owner may postpone a holiday or appliance replacement despite appearing wealthy on paper.
For a renter, rising property prices do not directly create spending money. Someone saving to buy may instead face a higher savings target. Any claim that higher home prices lift consumption needs to specify ownership, debt obligations and plans to purchase a home.
These are possible economic mechanisms, not separately proven effects from the paper. Nor do we transfer estimates from historical Chinese households into forecasts for Korean household spending.
The route from housing support to spending
When assessing policy, ask which household burden actually falls. A lower lending rate may reach existing borrowers only when their contracts reset. If borrowers use the savings to repay principal, the immediate increase in consumption can be modest.
Even with lower housing costs, a household worried about employment may rebuild emergency savings first. Stable income and more cash available could make postponed repairs or replacements more likely. Corporate revenue comes after these household decisions, not immediately after a policy announcement.
-
1
Lower housing costs
Actual relief in interest or rent
-
2
Cash allocation
Save, repay debt or spend
-
3
Consumer purchases
Replacement or repairs if income feels secure
-
4
Business orders
Reorders after inventory is absorbed
A revival in home transactions also differs from a revival in construction. Existing-home turnover may generate brokerage, moving and refurbishment demand without requiring new buildings. The type of transaction determines which businesses might benefit.
Korean companies need a customer-level view
The following are conditional scenarios for Korean businesses, not claims about reported results at particular companies. A product bought when moving into a new home has a different connection to property conditions from one bought to replace a broken item.
Premium appliances can be postponed or replaced by cheaper models. Unit sales may hold up while average selling prices decline. That average is revenue divided by units sold. A less profitable product mix, combined with higher promotion costs, can put greater pressure on earnings than on revenue.
Repair and replacement demand poses a different question. Some products need replacing without a home purchase. That does not guarantee market-share gains for Korean brands: local competitors’ prices, service networks and distribution charges still matter.
Premium purchases
Delay or trade down
Household choice
Earnings variable · Average price and promotions
Necessary replacement
Can occur without a home purchase
Household choice
Earnings variable · Competition, service and distribution costs
Inventory is the next earnings variable. Shipments to distributors can raise a manufacturer’s revenue even if sales to consumers lag. Unsold goods then accumulate in warehouses. Subsequent orders may weaken while requests for promotional support increase.
Company disclosures are more informative when China revenue growth is accompanied by consumer sell-through, distributor inventory and discounting trends. Expanding capacity ahead of durable final demand risks lower utilization. Factory rent and depreciation then have to be spread over fewer products.
Share prices can move before profits recover
Equity markets can react to policy expectations before orders improve. A rally in consumer stocks may reflect a higher probability assigned to recovery. The rally itself does not verify that recovery. Subsequent selling prices and margins provide a different kind of evidence.
Housing transactions, household income and retail sales should remain separate signals. A transaction recovery can coexist with slow spending if households prioritize debt reduction. Stronger consumption may still offer limited gains to Korean suppliers if demand concentrates on cheaper local products.
For related context, see China’s uneven domestic economy and US housing starts and builder discounts. This article focuses on households’ spendable cash, a different lens from aggregate sector performance.
The next releases should help answer three practical questions: Is spending strengthening beyond automobiles? Is housing-related demand driven by new purchases or replacement? Are inventories and discount burdens easing? Improvement across all three would strengthen the case for an earnings recovery. One positive indicator leaves room for other explanations.
Housing support alone is insufficient evidence of a consumer recovery. Ownership, the ability to access housing wealth, and income left after housing costs all matter for the next order. Information was checked as of September 26, 2026. This article does not recommend buying or selling any asset.
Look for a consumer recovery in spendable cash as well as property prices.
Sources
For information only — this is not a recommendation to buy or sell any asset.
Comments 0