Eurozone inflation hits 3.8% as energy jumps 18.8%: why Korean profits may diverge
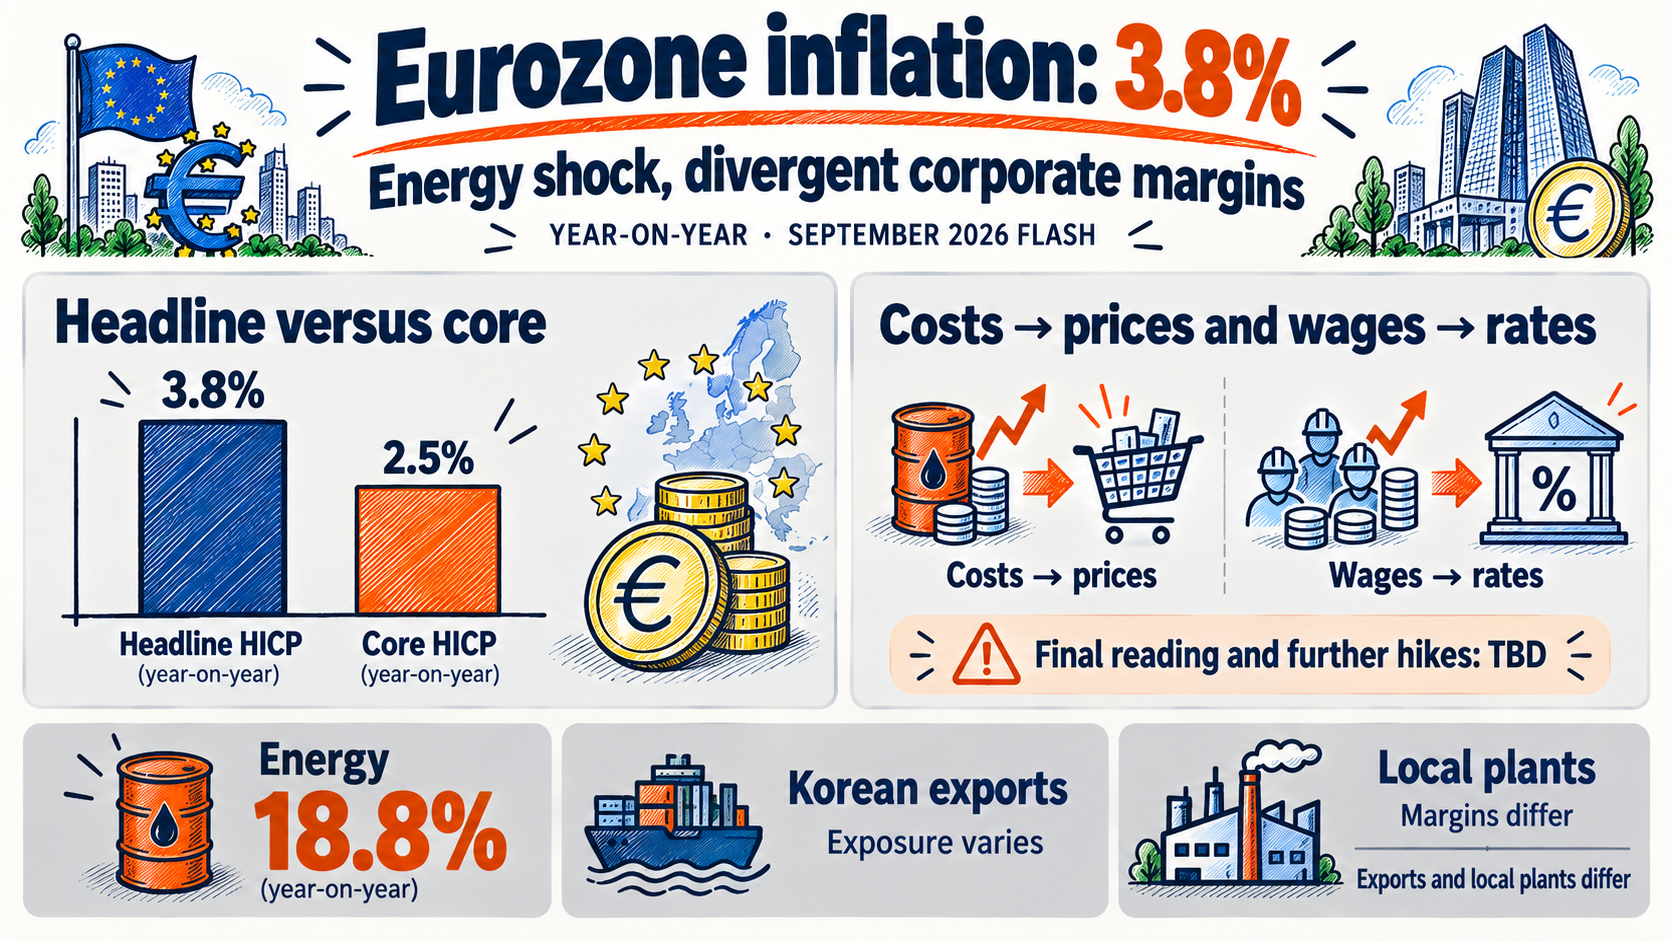
Eurozone inflation accelerated to 3.8% in September, from August’s final 3.2%, according to Eurostat’s October 2 flash release. Korean exporters face two competing forces: higher costs for European rivals may improve their relative prices, while weaker customer purchasing power may reduce orders. Source: Eurostat flash release
The starting point is energy, rather than proof of an economy-wide demand boom. The crucial questions are how far expensive fuel spreads through other prices and how much of the bill firms can pass to customers. The sector and currency discussion below is conditional analysis, not a stock recommendation.
What sits inside eurozone inflation of 3.8%?
HICP is the harmonised consumer-price index used for comparable inflation measures across countries. Annual energy inflation rose from 14.3% to 18.8%. Core inflation, excluding energy, food, alcohol and tobacco, edged up from 2.4% to 2.5%. Source: Eurostat component table
September flash: headline, energy and core. Eurostat, Oct 2, 2026. Rates, not contributions. Core excludes energy, food, alcohol and tobacco.
An 18.8% energy reading is not an 18.8-percentage-point contribution to total inflation. It measures energy prices against a year earlier. Contributions require expenditure weights and the index methodology. A separate exclusion measure, removing only energy and unprocessed food, is 2.2%; it is not the same core series.
Flash figures can be revised: August was initially reported at 3.3% and later finalised at 3.2%. This comparison uses the revised figure, rather than mixing different release vintages. Source: August final release
How an energy bill reaches wages and selling prices
An imported-energy shock raises the cost of producing the same output. A September 1 ECB analysis attributed the rise through May mainly to adverse energy supply shocks. It helps identify the mechanism, but is not a decomposition of September’s increase. Source: ECB analysis
Timing depends on contracts. A plant with fixed-price energy procurement may be temporarily insulated. A buyer exposed to spot prices pays sooner. If selling prices are also fixed, margins absorb the shock; contract renewals may allow customers to share it. Consumer energy inflation is not a direct measure of industrial electricity costs.
-
1
Import bill
Commodity prices and euro exchange rate
-
2
Operating costs
Repricing at contract renewal
-
3
Prices and wages
Pass-through and wage claims
-
4
Spending and investment
Purchasing power and financing costs
Currency movements alter the bill again. With dollar energy prices unchanged, a weaker euro raises the euro cost of imports; a stronger euro reduces it. Expected rate increases do not guarantee euro appreciation, because deteriorating growth and a larger energy import bill can work in the opposite direction.
Workers may seek compensation for lost purchasing power in later wage negotiations. If employers then raise selling prices, the original shock becomes more persistent. That outcome is not automatic: weak orders may instead squeeze profits and delay hiring or investment. A 2.5% core reading alone does not establish a wage-price spiral.
Core is only 2.5%, so why is the ECB still wary?
On September 10, ECB President Christine Lagarde explained a 25-basis-point increase while refusing to pre-commit to a future rate path. September’s inflation release adds new information after the Related: previous ECB decision. Interest rates cannot produce more oil, but can influence borrowing, spending and expectations. Source: ECB press conference
ECB Executive Board member Isabel Schnabel argued on September 30 that monetary policy cannot simply wait for indirect and second-round effects to materialise. The former include higher input costs reaching other goods; the latter involve wages and expectations. Low core inflation relative to the headline therefore does not eliminate the possibility of further action. Source: Schnabel speech
IMF Managing Director Kristalina Georgieva warned on September 7 about the shock’s persistence, while noting a less extreme price shift than Europe’s 2022 gas shock and potentially more economic slack. Weak demand can constrain pass-through. These are conditions that may limit the process the ECB is watching. Source: IMF speech
Further tightening remains a scenario. Persistent energy costs alongside firmer wages and services prices would strengthen the case. Weaker orders and employment with stable inflation expectations could increase the weight given to growth. Policy has to judge both the inflation risk and the cost of suppressing demand.
Do higher European costs help Korean exporters?
A Korean producer gains relative price competitiveness only if its own costs rise less than those of European rivals. Chemicals use energy as both fuel and feedstock, making the product-feedstock spread important. Even displaced European orders may deliver less profit if Korean input and shipping costs rise faster. This is a mechanism, not a claim of observed order gains.
For steel, the relevant energy mix varies by production process. Demand from automotive and construction customers matters as much as a competitor’s electricity bill. Compare delivered prices, including freight, specifications, customs costs and applicable trade measures; higher rival costs do not guarantee more volume in a shrinking market.
Machinery faces a different split. Expansion projects may be delayed, while energy-saving equipment becomes more valuable. Yet higher financing costs raise the return a customer requires from a project. Better energy savings alone do not secure a purchase order.
Korean production, EU exports
Smaller cost increase than rivals
Opportunity
Risk · Weaker orders and freight costs
European subsidiary
Local energy and wages
Costs
Currency · Match revenue, input and debt currencies
A European subsidiary has a different exposure. Euro revenues and euro wages provide a partial natural currency offset, but do not remove local energy inflation. Dollar inputs against euro sales can create additional vulnerability. A stronger euro against the won may boost translated revenue without improving the plant’s operating margin.
Household energy tariffs and industrial procurement costs also differ. Support that lowers a household bill may not reduce every factory’s costs. This connects to our earlier discussion of Related: energy support and corporate cash flow. Earnings analysis needs separate checks on volumes, selling prices and costs.
Household budgets, asset markets, and fear in the US versus greed in Korea
Households pay heating and transport bills before many discretionary purchases. More expensive energy can reduce the purchasing power available for other goods. Businesses also need more working capital to replenish inventories. If rates rise, maintaining the same sales level can cost more to finance, separating revenue growth from cash-flow improvement.
Assets face both a financing channel and an earnings channel. Higher expected rates can weigh on bond prices and the present value of future profits, while weaker activity can reduce those profits. Energy stabilisation could ease both pressures. None of this establishes the actual market reaction on release day.
The supplied snapshot puts CNN’s US Fear & Greed Index at 31.1, fear, on October 2—down 5.9 points from a week earlier and 15.0 from a month earlier. GoldKimp’s KOSPI reading was 60.5, greed, on October 1. Different methods and dates prevent a precise score comparison. Comparable Korean weekly and monthly history was unavailable. Source: CNN Source: GoldKimp
SentimenTrader’s homepage did not expose current Smart/Dumb Money readings. The latest visible dated public-post mirror showed 0.41 and 0.35, equivalent to 41% and 35%, on September 24—not October 2. These models are not actual institutional and retail cash flows. Whether Korean optimism can withstand European cost and rate pressure depends on orders and margins. Source: SentimenTrader Source: Dated public-post mirror
After the October 16 final data: what Korean firms should check
Ireland’s CSO lists October 16 as the scheduled release of the final September eurozone HICP. It has not yet been published. Check revisions and detailed contributions, then monitor pricing plans, wage negotiations and energy procurement contracts. Source: CSO release schedule
For Korean companies, ask whether European customers maintain volumes, whether new contracts recover higher costs, and whether buyers can finance efficiency projects. Relative price gains can be offset by weaker demand and financing expenses. That balance, rather than inflation alone, will shape the next earnings reports.
Higher costs for European rivals do not guarantee higher profits for Korean firms.
Sources
- Eurostat — September 2026 HICP flash estimate, 2 October
- Eurostat — August 2026 HICP final release, 17 September
- ECB — Christine Lagarde monetary policy statement, 10 September 2026
- ECB — Isabel Schnabel, Monetary policy in a world of overlapping shocks, 30 September 2026
- ECB Blog — Why the drivers of inflation matter for monetary policy, 1 September 2026
- IMF — Kristalina Georgieva, Monetary Policy with Supply Shocks and High Debt, 7 September 2026
- Ireland CSO — September HICP flash statement and final-release schedule, 1 October 2026
- CNN Fear & Greed — supplied pipeline snapshot, 2 October 2026
- GoldKimp KOSPI sentiment — supplied pipeline snapshot, 1 October 2026
- SentimenTrader — official homepage (current values not publicly visible)
- SentimenTrader public post mirrored by TwStalker — 24 September 2026 readings
For information only — this is not a recommendation to buy or sell any asset.
Comments 0