Japan tourism arrivals fell 9.6% — Why hotel and airline earnings may differ (Views 0)
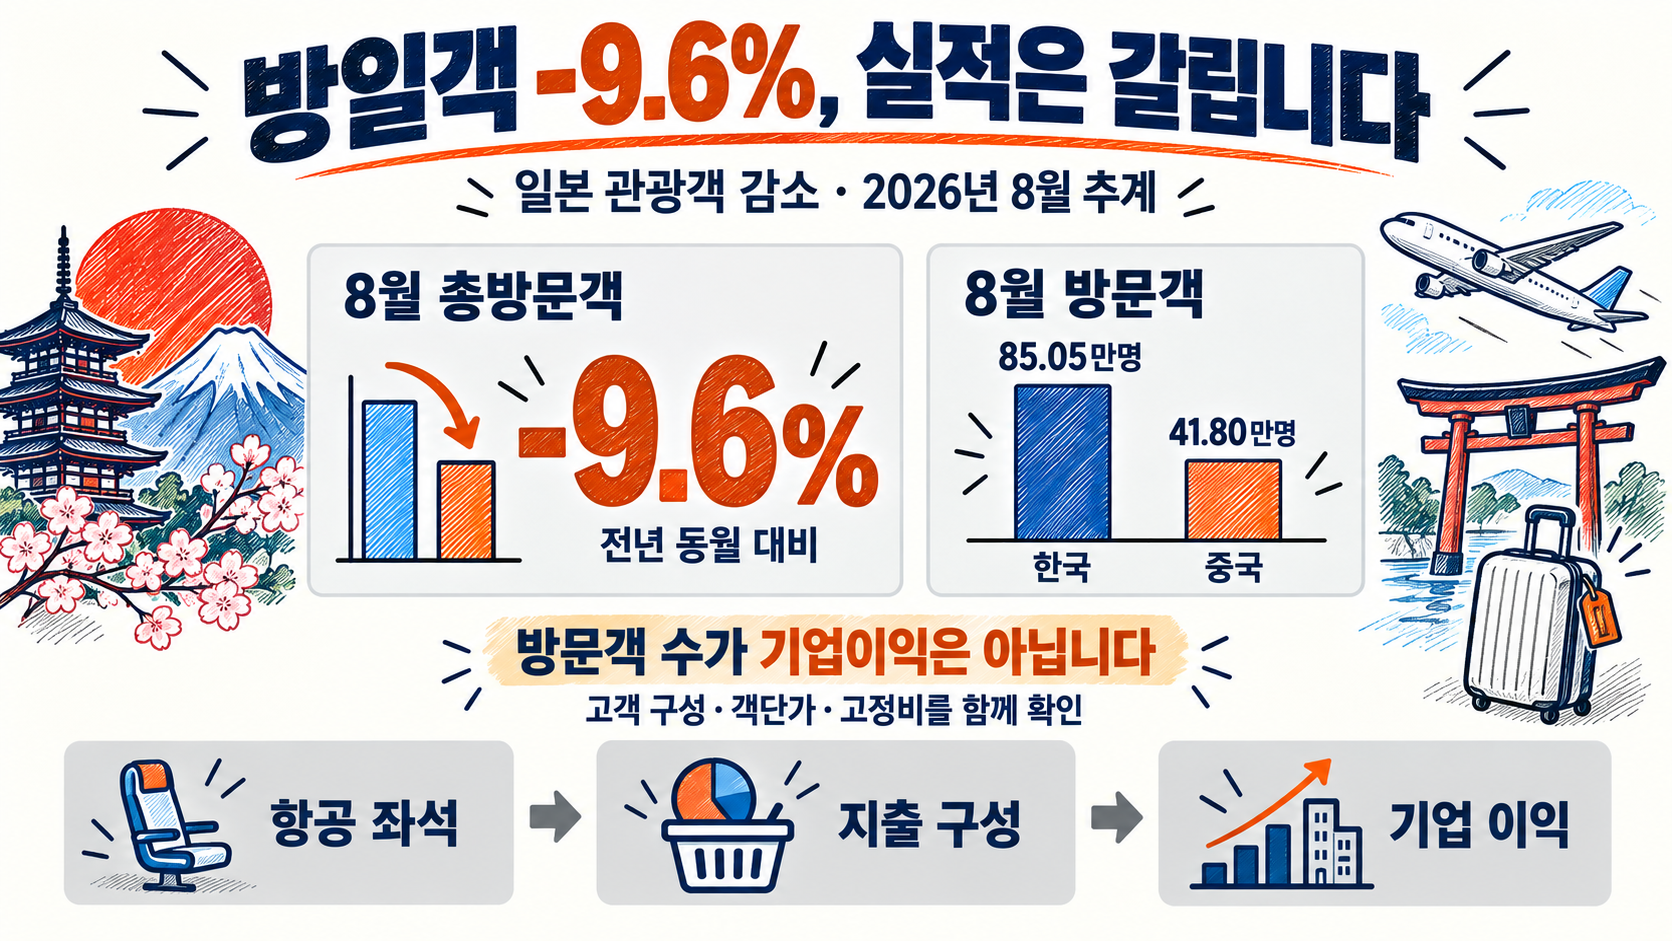
Foreign arrivals in Japan fell 9.6% in August 2026 to 3,098,900. But the decline in Japan tourism arrivals can affect hotels, duty-free retailers and Korean airlines differently. Who visits, where they spend and how much revenue remains after costs determine the impact on each business. JNTO, September 16
Arrivals from Korea increased even as the total fell. A particular route or destination can therefore grow within a shrinking aggregate market. The latest release is a story about the composition of demand as well as its size.
Information is current to September 17, 2026. August arrivals and second-quarter spending are identified separately below. Earnings and investment implications are conditional analysis, not reported company results or investment recommendations.
Japan tourism: not every market declined
JNTO reports that 14 source markets set August arrival records. Weakness in the total coexists with growth elsewhere, making a worldwide loss of interest in Japan an incomplete explanation. Reuters reporting in Japanese corroborates the headline decline.
Korean arrivals rose 28.7% to 850,500, while Chinese arrivals fell 59.0% to 418,000, according to Travel Voice’s reporting of JNTO figures. Kyodo corroborates the Korean figure; FNN separately reports a roughly 60% Chinese decline.
August visitors: Korea and China
Ten thousand visitors · selected marketsAugust 2026 arrivals: Korea 850500 and China 418000. August 2026 estimates. Korea +28.7% YoY; China -59.0%. Source: Travel Voice citing JNTO; cross-checked against Kyodo and FNN. Counts, not spending.
The chart compares only these two source markets, not the total or their spending. More Korean arrivals do not establish that Korean visitors spent more than Chinese visitors. Length of stay, accommodation and shopping all affect the bill.
JNTO arrivals also extend beyond leisure tourists and include certain expatriate and student entries. An arrival is neither a hotel booking nor an overnight stay. Treating these measures as interchangeable can distort business estimates.
An attractive exchange rate cannot create airline seats
JNTO mentions reduced flight services and typhoon cancellations in some markets. Fewer departures can prevent people from travelling on preferred dates. Higher fares or longer connections may also lead potential customers to postpone a trip.
The economic cost of travel includes tickets, accommodation, time and cancellation risk. A favourable yen exchange rate can be offset by expensive flights. Currency movements alone therefore cannot explain the change in arrivals.
Causation can run both ways. Airlines may cut flights after bookings weaken; fewer flights may then further constrain bookings. Observing a capacity reduction does not establish that weaker household demand was the original cause.
Weather disruption and sustained route reductions also have different recovery paths. Cancelled services may resume after a storm, while rebuilding scheduled capacity takes planning and sufficient demand. The release does not quantify each factor’s contribution. Ordinary seasonal slowing is not, by itself, an explanation for a year-on-year August decline.
Second-quarter spending held up despite fewer visitors
The Japan Tourism Agency’s first preliminary estimate puts April–June inbound spending at ¥2.5096 trillion, up 0.2% year on year. Spending per visitor rose 3.3% to ¥244,000. These are nominal yen amounts, as reported in the official spending release.
At its July briefing, the agency said higher spending per visitor supported total expenditure despite fewer visitors. It also said the reasons behind the United States becoming the largest source market by total spending needed further analysis. An observed ranking is not sufficient evidence of a particular currency effect. Official briefing
Within a consistent survey population, total spending can be understood as visitor numbers multiplied by spending per visitor. The latter depends on duration, daily expenses and shopping. Fewer people staying longer can sustain total expenditure. Higher prices can also lift nominal spending without increasing the quantity of services consumed.
Multiplying August arrivals by the second-quarter spending average would mix seasons, visitor groups and statistical coverage. The earlier quarter demonstrates that falling numbers can coexist with rising expenditure. It does not establish that August spending increased.
A separate arithmetic illustration helps show the scale involved. In an otherwise identical population, a 9.6% decline in visitors requires about 10.6% more spending per visitor to keep the total unchanged: 1 divided by 0.904, minus 1. This is neither an August spending estimate nor a forecast.
An empty hotel room and an empty shopping basket differ
For hotels, consider occupancy and the average rate charged for sold rooms together. Occupancy is the share of available rooms that are sold. Revenue per available room, or RevPAR, multiplies occupancy by that average rate. Stable prices can soften the revenue impact of lower occupancy; discounting alongside empty rooms compounds it.
Profit comes next. Rent and basic staffing costs do not immediately disappear when a few rooms are empty. These fixed costs can make profit fall faster than revenue. Conversely, filling more rooms with existing staff and facilities can allow a substantial share of additional revenue to reach profit.
How changing arrivals reach hotel profit
Mechanism · not an earnings forecastArrivals affect hotel revenue, costs, profit and investment. Editorial economic analysis. Domestic demand and regional differences also matter.
Duty-free stores and department stores need a different set of measures: the share of visitors buying something, the value of each purchase and product margins. Extra hotel and restaurant spending does not automatically reach luxury counters. Nationality can provide context, but purpose of travel and actual expenditure categories are more informative.
Domestic customers also matter. The agency’s first preliminary estimate puts Japanese residents’ domestic travel spending at ¥7.5361 trillion in the second quarter, up 11.7%. This provides another source of demand, but does not show that domestic visitors filled any particular August vacancy. Domestic travel spending release
If differences in demand persist, investment may diverge too. A property dependent on group arrivals might delay expansion; a hotel in a resilient location might renovate existing rooms to support higher rates. These are possible management responses, not announcements by named companies.
An opportunity for Korean airlines, competition for domestic tourism
Growing Korean arrivals support the potential customer base for Korea–Japan airlines and travel agencies. Translating that into earnings requires more information: seats sold relative to capacity, realised fares and the cost of transporting each passenger.
Simultaneous route expansion can intensify price competition. Full aircraft do not ensure strong earnings if fares fall and fuel expenses rise. Companies with dollar-denominated costs must also watch the won. Our analysis of oil costs in Korea explains that expense channel.
Korean hotels and restaurants face a different possibility. A limited holiday budget spent in Japan may compete with domestic purchases. But the entire increase in outbound travel cannot be treated as lost Korean spending: some travellers would have visited another foreign destination, while others may have increased their overall holiday budget.
A decline in Chinese visits to Japan likewise does not prove a windfall for Korean duty-free stores. Travellers must actually choose Korea and make purchases for that mechanism to operate. They might instead travel domestically in China, visit another country or cancel a trip.
Inbound spending has the character of service exports for Japan. Lower purchases can reach local suppliers and employment, but one tourism release cannot establish an economy-wide recession. The distinction between company receipts and income reaching households is explored in our article on profits and household income.
The next figures to watch before judging tourism stocks
Equities may respond to revisions in future earnings rather than the arrival number alone. No broad share-price fall is asserted here; that requires separate market evidence. Hotel property values also depend on maintenance expenditure and financing costs alongside customer demand.
Watch whether airline capacity and bookings recover, then compare regional overnight stays and room rates. For retailers, examine duty-free revenue and purchase values. Third-quarter spending data will eventually cover a period that includes the August decline.
Returning bookings and stable room rates after services resume would be consistent with a temporary disruption. Prolonged weakness combined with discounting would put more pressure on fixed-cost-heavy operators, employment and expansion plans. Neither path is established by the current release.
Japan tourism needs to be read through the customers who arrive, where they spend and how much revenue remains after costs. That is how to distinguish a company that copes with fewer visitors from one that attracts more customers but earns little extra profit.
After counting visitors, follow their spending and the profit businesses retain.
Sources
일본 관광객 감소 9.6%, 호텔·항공의 실적은 왜 다를까 (조회수 0)
2026년 8월 일본을 찾은 외국인은 309만8900명으로, 1년 전보다 9.6% 줄었습니다. 하지만 이번 일본 관광객 감소가 호텔·면세점·한국 항공사의 실적에 미치는 영향은 서로 다를 수 있습니다. 누가 방문해 어디에 돈을 썼는지, 그 매출에서 비용을 빼면 얼마가 남는지를 함께 봐야 합니다. JNTO 9월 16일 발표
한국에서 일본으로 떠나는 여행객은 오히려 늘었습니다. 전체 시장이 줄어도 특정 노선이나 특정 지역의 사업은 성장할 수 있다는 뜻입니다. 이번 통계가 보여 주는 변화는 관광 수요의 규모뿐 아니라 고객 구성에도 있습니다.
자료 기준일은 2026년 9월 17일입니다. 아래에서 8월 방문객과 2분기 소비를 각각 표시했습니다. 이후 기업 실적과 투자에 관한 설명은 이 자료를 바탕으로 한 조건부 분석이며, 매수·매도 권유가 아닙니다.
일본 관광객 감소, 모든 나라에서 줄어든 것은 아닙니다
JNTO는 8월에 14개 국가·지역이 해당 월 기준 역대 가장 많은 방문객을 기록했다고 밝혔습니다. 총계는 감소했는데 최고 기록을 세운 시장도 여럿입니다. “일본 여행이 전 세계적으로 식었다”는 설명은 이 차이를 놓칩니다. 총방문객 감소율은 Reuters의 일본어 보도에서도 확인됩니다.
국가별로는 한국 방문객이 85만500명으로 28.7% 늘었고, 중국은 41만8000명으로 59.0% 줄었습니다. JNTO 통계를 인용한 Travel Voice의 수치입니다. 한국 수치는 교도통신 보도와 일치하며, 중국 방문객이 약 6할 감소했다는 방향과 규모는 FNN 보도에서도 확인됩니다.
8월 방문객: 한국과 중국, 두 시장 비교
단위: 만명 · 전체 합계 아님2026년 8월 방일객 한국 85.05만명과 중국 41.80만명 비교. 2026년 8월 추계. 전년 동월 대비 한국 +28.7%, 중국 -59.0%. 출처: JNTO 통계를 인용한 Travel Voice, 교도·FNN 교차확인. 인원 비교이며 지출 비교가 아닙니다.
위 그림은 두 시장의 8월 인원만 비교합니다. 전체 방일객의 합계나 소비액을 나타내지 않습니다. 한국 방문객 수가 중국보다 많다는 사실만으로 한국인이 일본에서 쓴 돈도 더 많았다고 결론 내릴 수는 없습니다. 여행 기간과 숙소, 쇼핑 금액이 다르기 때문입니다.
통계에서 말하는 방일 외객은 순수한 휴가 여행객보다 범위가 넓습니다. JNTO 정의에는 일부 주재원·유학생 등의 입국도 포함됩니다. 방문객 한 명을 호텔 숙박 한 건으로 바꾸거나, 모든 방문을 관광 소비로 계산하면 실제 사업 규모와 차이가 생깁니다.
싼 환율만으로는 비행기 좌석을 만들 수 없습니다
JNTO는 일부 시장의 항공편 감소와 태풍에 따른 결항 등을 이번 발표에서 언급했습니다. 항공편이 줄면 가고 싶은 사람이 있어도 원하는 날짜에 출발하기 어렵습니다. 남아 있는 좌석 가격이 높아지거나 환승 시간이 늘면 여행을 미루는 사람도 생길 수 있습니다.
여행의 가격은 현지에서 쓰는 엔화만으로 정해지지 않습니다. 항공권, 숙박비, 이동 시간과 취소 위험까지 합친 부담이 중요합니다. 엔화가 싸게 느껴지더라도 항공권이 비싸지면 전체 여행비는 내려가지 않을 수 있습니다. 이 때문에 환율 하나로 방문객 증감을 설명하기는 어렵습니다.
여기에는 원인과 결과가 서로 영향을 주는 부분도 있습니다. 항공사는 예약이 약해져 운항을 줄일 수 있고, 줄어든 운항이 다시 예약을 제약할 수도 있습니다. 감편이 확인됐다는 사실만으로 처음 원인이 소비 부진이었다고 단정할 수 없습니다.
태풍으로 취소된 여행과 오랫동안 줄어든 노선은 회복 속도도 다릅니다. 날씨가 좋아지면 항공편은 재개될 수 있지만, 정기 노선을 복원하려면 수요와 운항 계획을 다시 맞춰야 합니다. 다만 이번 자료로 두 요인이 감소분의 몇 퍼센트를 설명하는지는 알 수 없습니다. 여름 휴가철이 끝나는 계절성도 같은 8월끼리 비교한 감소율을 설명하는 충분한 근거는 아닙니다.
방문객은 줄었는데 소비는 버텼습니다 — 2분기 수치
일본 관광청의 2026년 4~6월 1차 속보에서는 방일 외국인 여행 소비가 2조5096억엔으로 전년 동기보다 0.2% 늘었습니다. 1인당 지출은 24만4000엔으로 3.3% 증가했습니다. 관광청 소비동향 발표에 나온 명목 엔화 금액입니다.
관광청은 7월 기자회견에서 방문객 감소에도 1인당 지출 증가가 총소비를 지탱했다고 설명했습니다. 같은 회견에서 미국이 소비액 1위가 된 배경은 더 분석해야 한다고 밝혔습니다. 숫자는 확인하되 그 원인을 곧바로 환율이나 특정 국적의 소비 성향으로 단정하지 않는 태도가 필요합니다. 관광청 기자회견
여행 지출은 같은 조사 범위 안에서 대략 방문 인원과 1인당 지출을 곱한 크기로 생각할 수 있습니다. 1인당 지출은 다시 체류 기간, 하루 지출, 쇼핑 구성에 영향을 받습니다. 적은 사람이 오래 머물거나 더 비싼 숙소를 선택하면 총액은 버틸 수 있습니다. 반대로 객단가가 올라 보여도 단순한 물가 상승이라면 실제 이용한 서비스 양은 늘지 않았을 수 있습니다.
여기서 8월 인원에 2분기 평균 지출을 곱해 8월 매출을 추정하면 곤란합니다. 계절도, 방문객 구성도, 조사 범위도 같지 않습니다. 2분기 자료는 인원 감소와 소비 증가가 함께 나타날 수 있다는 사례이며, 8월 소비가 증가했다는 증거는 아닙니다.
계산 원리만 따로 보겠습니다. 동일한 조사 범위를 가정하고 방문객이 9.6% 줄었다면 총지출을 유지하려면 1인당 지출이 약 10.6% 늘어야 합니다. 1을 0.904로 나눈 뒤 1을 빼면 나오는 값입니다. 이는 실제 8월 객단가나 전망이 아니라, 인원 감소를 상쇄하는 데 필요한 크기를 보여 주는 산술 예시입니다.
호텔의 빈방과 면세점의 빈 장바구니는 다릅니다
호텔 매출을 보려면 객실 가동률과 평균 객실요금을 함께 봐야 합니다. 가동률은 팔 수 있는 방 중 실제로 판매한 방의 비율입니다. 객실당 매출인 RevPAR는 가동률에 판매된 객실의 평균 요금을 곱한 값입니다. 방이 덜 차더라도 요금을 유지하면 매출 감소를 줄일 수 있지만, 빈방을 채우려고 가격까지 내리면 두 압력이 겹칩니다.
그다음에 이익을 봅니다. 객실 몇 개가 비어도 임차료와 기본 인건비는 바로 줄지 않습니다. 이렇게 매출과 함께 움직이지 않는 비용을 고정비라고 합니다. 매출이 조금 줄었는데 이익이 훨씬 크게 줄 수 있는 이유입니다. 반대로 이미 확보한 방과 인력으로 손님을 더 받으면 추가 매출의 상당 부분이 이익으로 남을 수 있습니다.
방문객 변화가 호텔 이익에 도달하는 과정
구조 설명 · 실적 전망 아님방문객 변화에서 숙박 매출과 고정비를 거쳐 호텔 이익과 투자로 이어지는 흐름. 편집부의 경제적 해석. 내국인 수요와 지역별 차이도 함께 확인해야 합니다.
면세점과 백화점은 방문객 수 외에 실제 구매 비율, 1회 구매액, 판매 상품의 이익률을 봐야 합니다. 숙박과 음식에 돈을 더 쓴 여행객이 늘었다고 명품 매장의 매출까지 같은 비율로 늘지는 않습니다. 어느 나라 고객인지도 참고할 수 있지만, 국적보다 여행 목적과 소비 항목을 직접 확인하는 편이 정확합니다.
일본 관광업에는 내국인 수요도 있습니다. 관광청의 2분기 1차 속보에서 일본인 국내여행 소비는 7조5361억엔으로 11.7% 늘었습니다. 외국인 감소가 모든 호텔의 수요 감소로 이어지지 않을 수 있다는 배경입니다. 다만 이 역시 2분기 자료이므로 8월의 빈방을 내국인이 실제로 채웠다는 뜻은 아닙니다. 일본인 국내여행 소비동향
이런 차이가 이어지면 투자 방향도 달라질 수 있습니다. 외국인 단체 손님에 의존한 시설은 확장 계획을 늦출 수 있고, 수요가 견조한 지역의 호텔은 새 건물을 짓는 대신 기존 객실을 고쳐 요금을 높이는 선택을 할 수 있습니다. 이는 가능한 경영 대응이며, 특정 기업이 이미 결정한 투자 계획을 뜻하지 않습니다.
한국 항공사에는 기회, 국내 관광업에는 경쟁입니다
한국인의 일본 방문 증가는 한일 노선을 운항하는 항공사와 여행사의 수요 기반에 긍정적인 신호입니다. 하지만 고객이 늘었다는 사실과 항공사 이익이 늘었다는 결론 사이에는 몇 가지 확인이 필요합니다. 늘린 좌석이 얼마나 팔렸는지, 할인 항공권 비중이 높아지지는 않았는지, 한 사람을 실어 나르는 비용이 얼마나 드는지입니다.
항공사가 한꺼번에 일본 노선을 늘리면 운임 경쟁이 심해질 수 있습니다. 비행기가 꽉 차도 항공료가 크게 내려가고 연료비가 오르면 이익은 약할 수 있습니다. 달러로 부담하는 비용이 있는 회사는 원화 환율도 중요합니다. 비용의 전달 경로는 유가 상승이 한국 기업에 미치는 영향에서 함께 볼 수 있습니다.
국내 호텔·외식업에는 다른 계산이 필요합니다. 한정된 휴가비가 일본 숙박과 식당으로 이동하면 국내 소비와 경쟁할 수 있습니다. 그렇다고 한국인의 일본 방문 증가분 전체를 국내 소비 손실로 계산할 수는 없습니다. 원래 다른 해외로 갈 사람이 일본을 선택했거나 여행 지출 자체를 늘린 경우도 있기 때문입니다.
중국의 일본 방문객 감소가 한국 면세점의 수혜로 이어진다는 주장도 아직은 조건부입니다. 그 여행객이 실제로 한국을 선택했는지, 어디서 얼마를 썼는지 확인해야 합니다. 일본을 가지 않은 사람이 중국 안에서 여행하거나 여행 자체를 취소할 수도 있습니다. 방문객의 이동과 지출을 확인하기 전에 수혜주를 정하면 분석 순서가 뒤집힙니다.
일본의 관광 소비는 해외 고객에게 숙박·음식·교통 서비스를 판매하는 서비스 수출 성격을 가집니다. 그 지출이 줄면 지역 업체의 주문과 고용에도 영향이 갈 수 있습니다. 다만 관광업의 변화만으로 일본 전체의 경기 침체를 예고하기는 어렵습니다. 업종 이익이 임금과 소비로 퍼지는 과정은 기업이익과 가계소득의 차이를 다룬 글과 연결해서 읽을 수 있습니다.
관광주를 볼 때 다음에 확인할 숫자
주가는 이미 알려진 방문객 감소보다 앞으로의 이익 예상이 얼마나 바뀌는지에 반응할 수 있습니다. 따라서 이번 수치가 발표됐다고 관광주가 실제로 일제히 하락했다고 단정하지 않습니다. 주가 반응은 별도의 시장 자료가 필요합니다. 호텔 부동산 가격도 객실 수요뿐 아니라 유지·보수비와 대출이자 부담에 영향을 받습니다.
앞으로는 항공 좌석 공급과 예약이 회복되는지 먼저 확인할 만합니다. 이어 호텔의 지역별 숙박일수·객실요금, 소매업의 면세 매출과 구매액을 보면 손님 수 변화가 돈으로 어떻게 이어지는지 알 수 있습니다. 마지막으로 3분기 관광 소비가 나오면 8월의 방문객 감소를 포함한 기간의 지출을 확인할 수 있습니다.
항공편 복원과 함께 예약이 돌아오고 객실요금이 유지된다면 일시적 차질에 가까운 그림입니다. 반대로 방문객 부진이 이어지고 할인 판매까지 늘면 고정비가 큰 업체의 이익과 신규 투자가 먼저 압박받을 수 있습니다. 두 경로 가운데 어느 쪽인지는 아직 확정되지 않았습니다.
이번 일본 관광객 감소에서 읽어야 할 것은 손님의 총수만이 아닙니다. 어떤 손님이 어느 지역에서 얼마를 쓰고, 그 매출 중 얼마가 기업에 남는지를 봐야 합니다. 여행객이 줄어도 버티는 회사와 사람이 늘어도 돈을 못 버는 회사를 구분하는 기준이 여기에 있습니다.
방문객 통계 다음에는 손님이 쓰는 돈과 기업에 남는 이익을 확인해야 합니다.
답글 남기기