Google Stock Drop — Cloud +82%, Capex Guide to $205B (Views 4)
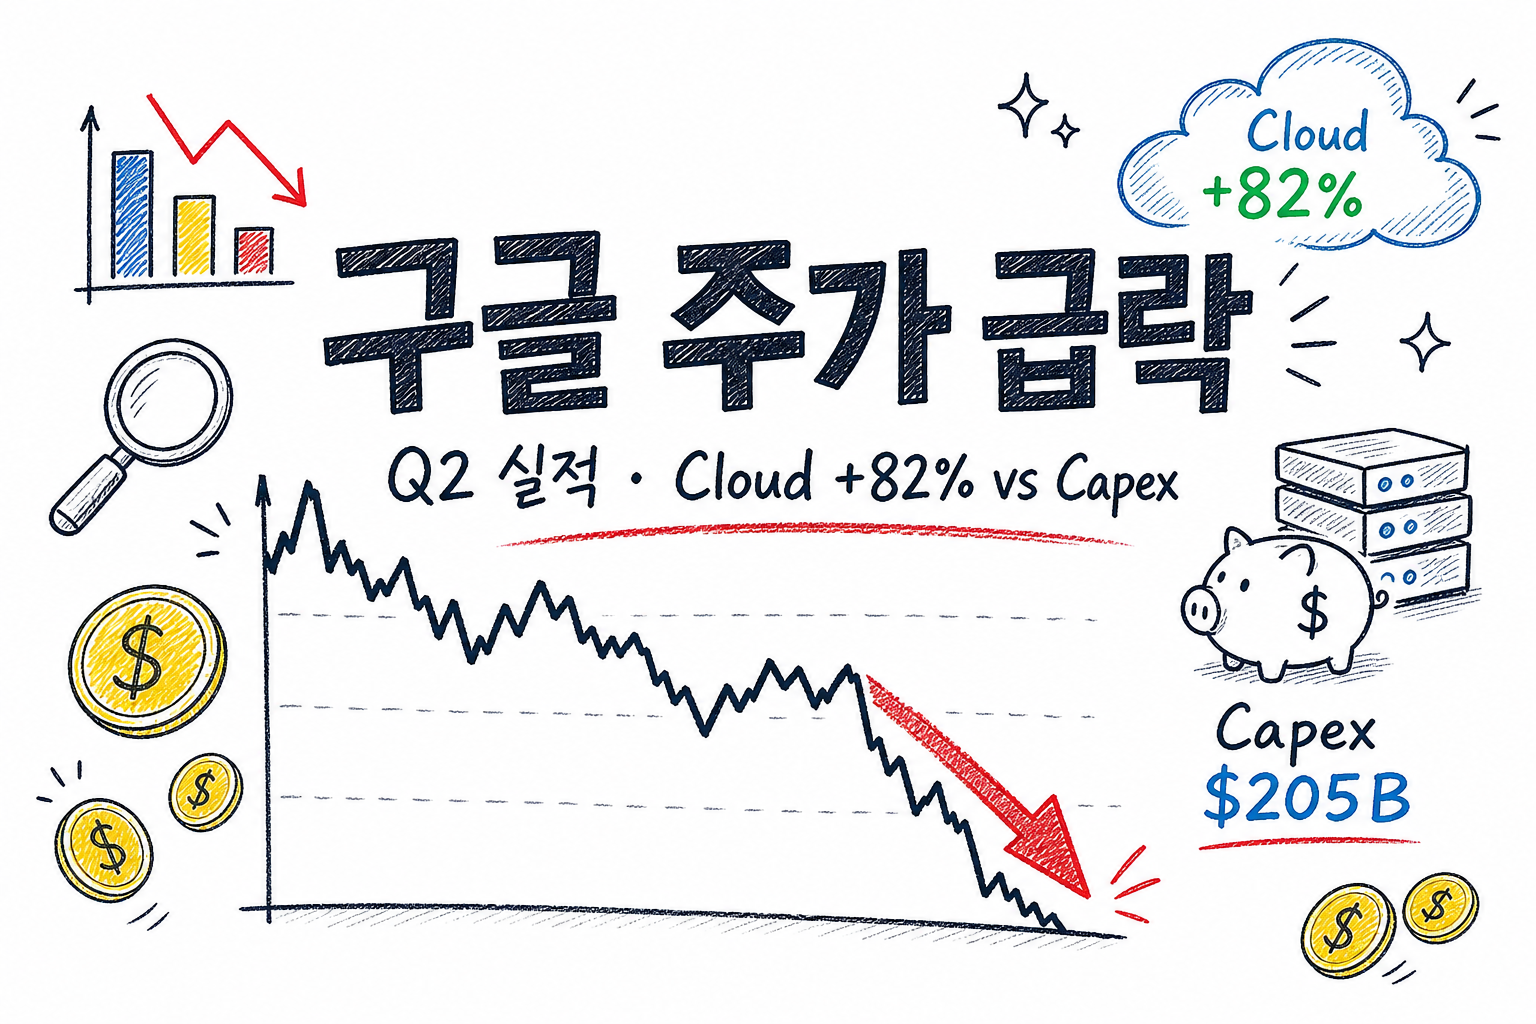
The Google stock drop showed up in after-hours trading after Alphabet (GOOGL/GOOG) reported Q2 2026 results on July 22, 2026 (US close). The regular session finished at $341.91 (−1.24%); after-hours prints around $327 (about −4% vs the close, roughly −5% vs the prior day) dominated the headlines.
The twist: this was not a failed quarter. Revenue hit $119.8B (+24%), beating estimates, and Google Cloud grew +82%, well ahead of the Street. Shares still sold off because investors focused on Capex guidance and the quality of earnings more than the top line.
Below we unpack the segment numbers, why $9.11 EPS is misleading, what Capex and free cash flow (FCF) are saying, and what to watch into Q3 and 2027. This is not a buy/sell recommendation for any stock or ETF.
At a glance — good news and bad news in one print
Capex is cash spent on long-lived assets such as data centers and servers. FCF is operating cash after that spending—what is left (or short). Alphabet still generated large operating cash, but investment outran it, so FCF turned negative for the quarter.
- Positives: Revenue $119.8B beat; Cloud $24.8B (+82%); cloud operating margin 35.6%; backlog $514B
- Optical illusion: Diluted EPS $9.11 — mostly equity-mark gains (~$99B). Core-like EPS ~$2.85 (vs ~$2.89 expected; slight miss)
- What the market hated: FY2026 Capex raised to $195–205B; Q2 Capex $44.9B (+100%); FCF −$5.9B
- Near-term worries: More third-party compute in Q3 → modest margin pressure; Search faces tough year-ago comps
Why a beat still sold off
FlowFlow from earnings beat to Capex, FCF, and stock reaction. Conceptual. AH prices from press. Not advice.
Q2 numbers — revenue and operating profit first
Consolidated revenue was $119.8B, up 24% year over year (23% in constant currency), beating LSEG’s ~$116.93B. It was Alphabet’s 12th straight quarter of double-digit revenue growth.
Core profitability was solid: operating income $40.8B and a 34% operating margin (+2 percentage points). The business is not ‘broken.’ The issue sits lower on the income statement—net income and EPS—where equity valuation gains loom large.
Reported diluted EPS was $9.11 (+294%) and net income available to common was $112.1B. Other income was about $98.0B, driven by ~$99.0B of gains on equity securities. Per the 8-K FAQ, those gains added about $6.26 to EPS—implying a core-like EPS near $2.85. CNBC’s adjusted EPS of $2.85 also slightly missed LSEG’s $2.89.
In plain terms, much of the profit was not cash that hit the bank—it was a mark-up on stakes such as Anthropic and SpaceX. If those marks reverse next quarter, the headline swings the other way. Reports that SpaceX shares softened after quarter-end fed skepticism about how ‘durable’ that EPS is.
Segments — Cloud stole the show; Search was tight
Google Services revenue was $94.5B (+15%). Search was $63.3B (+17%), a slight miss versus StreetAccount’s ~$63.4B. YouTube ads were about $11.06B (+13%), ahead of estimates in the live coverage.
The star was Google Cloud: $24.8B of revenue, +82% year over year, versus expectations near +64% / ~$22.4B. Cloud operating income hit $8.8B, more than tripling, with margin rising from 20.7% to 35.6%. Backlog reached $514B, up more than $50B sequentially.
Growth came from GCP enterprise AI solutions and infrastructure plus core GCP. Alphabet also recognized TPU system sales delivered into customer data centers for the first time; management said growth still accelerated excluding that. Other Bets (including Waymo) contributed $382M (+2.4%)—still tiny versus the core.
Segment revenue growth — YoY %
BarBar chart of Search, YouTube, and Cloud revenue growth rates. CNBC/8-K. Search +17%, YouTube ads +13%, Cloud +82%, Services +15%. Not advice.
Why it fell — Capex $195–205B and negative FCF
Q2 Capex was $44.9B, up 100% year over year. CFO Anat Ashkenazi said most of it went to technical infrastructure for AI—about 60% servers and 40% data centers and networking.
The bigger shock was the full-year guide: Capex of $195–205B, up from $180–190B last quarter and above the ~$188B the market had been modeling. Management framed it as accelerating capacity for demand. Equity markets heard more cash leaving the building.
That shows up in FCF. Non-GAAP free cash flow was −$5.855B: $39.069B of operating cash versus $44.924B of property and equipment purchases. Spending briefly outran cash generation—common in AI buildouts, but hard on multiples when the stock already priced in a lot of success.
Capex guidance — prior vs new
ComparePrior guide (after Q1)
Now (after Q2)
Comparison of prior Capex guide vs new $195–205B range. Company guidance. Q2 Capex $44.9B (+100%). Not advice.
Q3 color added fuel. In a supply-constrained environment, Alphabet plans to use more third-party capacity as a bridge, which management said will create modest near-term margin pressure. After-hours pops in names like CoreWeave and Nebius showed how fast the tape priced ‘Google will rent more outside GPUs.’
AI, ads, Search — product signals
CEO Sundar Pichai said AI investments are redefining what is possible across the business. The Gemini app has about 950 million monthly active users and processes about 22 billion API tokens per minute (up from 16 billion). Antigravity, the coding tool, has 2.4 million+ weekly active users.
On ads, customers using tools such as Performance Max and AI Max saw about 50% more conversions on Search at similar ROAS, the company said. During the FIFA 2026 World Cup, Search usage hit an all-time high and YouTube logged 1.7 billion unique viewers of World Cup–related video.
Search comps get harder in Q3 as Alphabet begins lapping last year’s acceleration. The CFO said AI continues to improve the user and advertiser experience—but investors should expect tougher year-over-year compares. When Cloud is this strong, the tape gets pickier about a tiny Search miss and the next quarter’s path.
Outlook — four things to watch
This is a watchlist, not a price target. The broader AI infrastructure cycle overlaps our semiconductor selloff and bottleneck outlook.
- Backlog → revenue: How fast the $514B Cloud backlog converts into sales and margin
- Capex & FCF: Pace of the $195–205B spend and when quarterly FCF turns positive again. 2027 was already flagged to ‘significantly increase’ (April call); street chatter has cited mid/high-$250B estimates
- Search growth: Whether mid-teens growth holds through the Q3 lap, and whether AI Mode defends queries and ad pricing
- Earnings quality: If Other income / equity marks swing again, headline EPS will distort—pair it with operating EPS and margin
Pre-print aggregations showed a heavy Buy skew and average 12-month targets near $430. That was a pre-earnings snapshot; Capex resets force target and multiple revisions. For index vs dollar regimes, see our US market correction and DXY history note.
The bull path is straightforward: Cloud keeps compounding, Capex unlocks capacity, and margins re-expand. The bear path is Capex staying ahead of cash generation, Search decelerating, and mark-to-market noise dominating the P&L. Both are live paths—neither is proven yet.
Checklist for Korea-based readers
Many Korean investors hold GOOGL/GOOG directly or via US big-tech / Nasdaq ETFs. For ETF fees and tax structure, see our Korea–global ETF tax and fee guide. Liquidity and rates context also overlaps Fed hold / wallet impact.
- Do not stop at headline EPS ($9.11)—check core EPS and operating margin
- Read Cloud growth together with Capex guidance and FCF
- Next print: Q3 Search growth, third-party capacity costs, and margin commentary
- In ETF baskets, watch Google’s weight plus co-movement with other AI Capex-sensitive names
Bottom line
This Google stock drop was less ‘bad earnings’ than an A-grade Cloud report with a bigger Capex invoice. $119.8B revenue and Cloud +82% are real positives; $9.11 EPS was inflated by equity marks; $195–205B Capex and negative FCF tripped the stock. The next test is how fast backlog becomes profit.
This summary is based on filings and press coverage and is not investment advice. Trading and sizing decisions should rest on your own judgment and the latest disclosures.
Cloud scored an A; Capex was the invoice the tape priced first.
Sources
- CNBC — Google Q2 2026 earnings live updates
- Alphabet 8-K / StockTitan filing summary
- Investing.com — earnings call transcript summary
- MarketBeat — GOOG Q2 2026 earnings / transcript
- TradingKey — selloff after EPS beat
- InsiderFinance — preview & analyst targets
- Internal: 2026-07-23-alphabet-q2-earnings-stock-drop-session-01.md
구글 주가 급락 — Q2 클라우드 +82%인데 Capex $205B (조회수 4)
구글 주가 급락은 미국 기준 2026년 7월 22일 장 마감 후 Alphabet(GOOGL·GOOG) 2분기 실적이 나온 뒤, 시간외에서 두드러졌습니다. 정규장 종가는 $341.91(−1.24%)이었고, 시간외는 대략 $327대(종가 대비 약 −4%대, 전일 대비 약 −5%대)로 보도됐습니다.
이상한 점은 ‘망한 실적’이 아니라는 점입니다. 매출은 $119.8B(+24%)로 기대를 웃돌았고, Google Cloud는 +82%로 시장을 크게 앞질렀습니다. 그런데도 주가가 빠진 이유는, 시장이 매출보다 설비투자(Capex) 가이던스와 본업 이익의 질을 먼저 봤기 때문입니다.
이 글에서는 Q2 숫자를 세그먼트별로 풀고, EPS $9.11이 왜 착시인지, Capex·자유현금흐름(FCF)이 무엇을 말하는지, 그리고 3분기·2027을 볼 체크포인트까지 이어 씁니다. 특정 종목·ETF의 매수·매도 권유가 아닙니다.
한눈에 — 호재와 악재가 동시에 나온 밤
Capex는 회사가 데이터센터·서버처럼 오래 쓰는 설비에 넣는 돈입니다. FCF(자유현금흐름)는 영업으로 번 현금에서 그 설비투자를 뺀 뒤, 실제로 남는지(또는 부족한지)를 보는 숫자입니다. 이번 분기 Alphabet은 영업현금은 크게 벌었지만, 투자 규모가 더 커서 FCF가 적자로 돌아섰습니다.
- 호재: 매출 $119.8B 비트, Cloud $24.8B(+82%), 클라우드 영업이익률 35.6%, 백로그 $514B
- 착시: 희석 EPS $9.11 — 지분평가 이익(~$99B)이 대부분. 본업에 가까운 EPS ~$2.85(기대 ~$2.89 소폭 미스)
- 악재로 읽힌 것: FY2026 Capex $195–205B로 재상향, Q2 Capex $44.9B(+100%), FCF −$5.9B
- 근기 우려: Q3 외부 컴퓨트 임차 → 단기 마진 압력, 검색은 전년 가속 구간과의 비교 부담
왜 호실적인데 주가가 빠졌나
흐름도실적 호조에서 Capex·FCF로 이어지는 주가 반응 흐름도. 개념용. 시간외 가격은 보도 기준. 투자 권유 아님.
Q2 실적 숫자 — 매출·영업이익부터
연결 매출은 $1,198억으로 전년 같은 분기($964억대) 대비 24% 늘었습니다. 환율 효과를 제외한 상수 통화 기준으로는 23%입니다. 월스트리트 기대(LSEG 약 $1,169억)를 웃돈 매출 비트입니다. Alphabet 기준으로는 12분기 연속 두 자릿수 매출 성장입니다.
본업의 수익성도 나쁘지 않습니다. 영업이익은 $408억, 영업이익률은 34%로 전년보다 2%p 올랐습니다. ‘사업이 안 돌아간다’는 그림이 아닙니다. 문제는 그 아래 줄—순이익과 EPS—에 지분 평가 이익이 크게 섞여 있다는 점입니다.
공식 희석 EPS는 $9.11(+294%), 보통주 귀속 순이익은 $1,121억입니다. Other income(기타손익)이 약 $980억이고, 그중 지분증권 관련 이익이 약 $990억입니다. 8-K FAQ 기준으로 이 이익이 EPS에 약 $6.26을 보탰습니다. 빼면 본업에 가까운 EPS는 대략 $2.85입니다. CNBC가 전한 조정 EPS도 $2.85로, LSEG 기대 $2.89를 살짝 밑돌았습니다.
쉽게 말하면, 통장에 돈이 들어온 이익이 아니라, 보유 중인 Anthropic·SpaceX 같은 지분의 장부 가치가 오른 분이 상당 부분입니다. 다음 분기에 그 가치가 내려가면 숫자도 반대로 흔들릴 수 있습니다. SpaceX 주가가 분기말 이후 조정을 받았다는 보도도 나와, 평가이익의 ‘지속성’을 시장이 깎아 본 배경이 됩니다.
세그먼트 — 클라우드가 주인공, 검색은 아슬아슬
Google Services(검색·유튜브·네트워크 광고 등) 매출은 $945억(+15%)입니다. 그중 검색은 $633억(+17%)으로, StreetAccount 기대(약 $634억)를 살짝 밑돌았습니다. YouTube 광고는 약 $110.6억(+13%)으로 기대를 웃돈 것으로 보도됐습니다.
진짜 주인공은 Google Cloud입니다. 매출 $248억, 전년 대비 +82%입니다. 시장이 보던 대략 +64%·$224억대를 크게 넘어선 비트입니다. 클라우드 영업이익은 $88억으로 전년의 세 배가 넘고, 영업이익률은 20.7% → 35.6%로 뛰었습니다. 수주 잔고(백로그)는 $5,140억으로, 한 분기 만에 $500억 이상 늘었습니다.
성장 동력은 GCP의 기업 AI 솔루션·AI 인프라, 그리고 코어 클라우드입니다. 이번 분기에는 고객 데이터센터로 납품한 TPU 시스템 판매 매출이 처음 잡혔습니다. 경영진은 TPU 판매를 빼도 클라우드 성장이 의미 있게 가속했다고 설명했습니다. Other Bets(웨이모 등)는 매출 $3.82억(+2.4%)로 아직 본업 규모와는 거리가 있습니다.
세그먼트 매출 성장 — YoY %
막대검색·유튜브·클라우드 매출 성장률 세로 막대 그래프. CNBC·8-K 기준. Search +17%, YouTube ads +13%, Cloud +82%, Services +15%. 투자 권유 아님.
왜 떨어졌나 — Capex $195–205B와 FCF 적자
2분기 Capex는 $449억으로 1년 전보다 100% 늘었습니다. CFO Anat Ashkenazi는 대부분을 AI를 위한 기술 인프라에 썼고, 그 안에서 서버가 약 60%, 데이터센터·네트워킹이 약 40%라고 했습니다.
더 큰 충격은 연간 가이던스입니다. 회사는 2026년 Capex를 $1,950억–$2,050억으로 올렸습니다. 직전 분기 안내($1,800억–$1,900억)보다 한 단계 더 올린 것이고, 시장이 보던 대략 $1,880억대보다도 위입니다. ‘수요가 많아서 용량을 더 빨리 깐다’는 설명인데, 주가 입장에서는 당장 나갈 현금이 커진다는 뜻입니다.
그 결과가 FCF입니다. Non-GAAP 자유현금흐름은 −$58.6억입니다. 영업활동으로 $390.7억이 들어왔지만, 설비 구매에 $449.2억이 나갔습니다. 성장에 쓰는 돈이 벌어들인 현금을 잠시 앞지른 상태입니다. AI 사이클에서는 흔한 패턴이기도 하지만, 밸류에이션이 이미 높은 구간에서는 멀티플을 누르는 재료가 됩니다.
Capex 가이던스 — 직전 vs 이번
비교직전 가이던스 (Q1 후)
이번 (Q2 후)
직전 Capex 가이던스와 이번 195–205B 상향 비교. 회사 가이던스. Q2 실적 Capex $44.9B(+100%). 투자 권유 아님.
여기에 Q3 힌트가 겹칩니다. 공급이 부족한 상황에서 당분간 외부 클라우드 용량을 더 빌리겠다고 했고, 그 전략이 단기적으로는 마진에 부담이 된다고 했습니다. CoreWeave·Nebius 같은 관련주가 시간외에 반등했다는 보도는, ‘구글이 남의 용량을 산다’는 메시지를 시장이 빠르게 읽었다는 뜻입니다.
AI·광고·검색 — 제품 쪽 신호
CEO Sundar Pichai는 AI 투자가 사업 전반의 가능성을 다시 쓰고 있다고 했습니다. Gemini 앱 월간 활성 사용자는 약 9.5억, API는 분당 약 220억 토큰을 처리한다고 했습니다(직전 분기 160억). 코딩 도구 Antigravity는 주간 활성 240만+입니다.
광고에서는 Performance Max·AI Max 같은 도구를 쓰는 고객이 검색에서 전환이 평균 50% 더 늘었다(비슷한 광고 효율 기준)고 했습니다. FIFA 2026 월드컵 기간에는 검색 사용이 사상 최고 수준이었고, 유튜브에서 월드컵 관련 영상을 본 고유 시청자는 17억으로 소개됐습니다.
다만 검색은 Q3부터 비교가 빡세집니다. 작년 3분기부터 검색이 가속했던 구간을 이제 넘어서기 때문입니다. CFO는 AI로 검색·광고 경험을 개선하는 흐름은 이어가되, 숫자 비교는 조심하라고 했습니다. 클라우드가 빛나는 분기일수록, 시장은 검색의 ‘미세 미스’와 다음 분기 가이드를 더 예민하게 봅니다.
앞으로 전망 — 볼 네 가지
전망은 목표가·매수 신호가 아닙니다. 실적 콜과 공시에서 이어지는 관찰 포인트입니다. AI 인프라 사이클의 큰 그림은 반도체 매도·병목 전망 글과도 맞닿아 있습니다.
- 백로그 → 매출: Cloud 백로그 $514B가 실제로 매출·마진으로 얼마나 빠르게 바뀌는지
- Capex·FCF: $195–205B 집행 속도와 분기 FCF가 언제 다시 흑자로 돌아오는지. 2027은 이미 ‘크게 늘 것’이라고 예고된 상태(4월 콜). 시장 추정 보도는 $2,500억대 후반도 거론
- 검색 성장: Q3 lapping 구간에서 +%가 얼마나 버티는지, AI Mode가 쿼리·광고 단가를 지키는지
- 이익의 질: 다음 분기 Other income·지분평가가 다시 흔들리면 헤드라인 EPS는 또 왜곡됩니다. 본업 EPS·영업이익률을 같이 보기
실적 전 기준으로는 Buy 의견이 많고 12개월 목표가 평균이 $430대라는 집계도 있었습니다. 다만 그건 ‘실적 전’ 스냅샷이고, Capex 상향 이후 목표가·멀티플은 다시 쓰입니다. 미국 증시 전체의 조정·달러 레짐은 미국 증시 조정·DXY 역사와 함께 보면, 개별 종목 노이즈와 지수 흐름을 분리하기 쉽습니다.
긍정 시나리오는 단순합니다. 클라우드가 지금 속도로 크고, Capex가 용량 부족을 풀며, 마진이 다시 올라가는 경우입니다. 리스크 시나리오는 Capex가 계속 앞서 나가고, 검색이 둔화하며, 평가이익 변동성이 손익을 흔드는 경우입니다. 둘 다 ‘가능한 경로’이지, 한쪽을 단정할 재료는 아직 없습니다.
한국 투자자가 볼 체크리스트
국내에서는 GOOGL·GOOG를 직구하거나, 미국 빅테크·나스닥 추종 ETF로 간접 노출하는 경우가 많습니다. ETF 보수·세금 구조는 국내·해외 ETF 세금·보수 가이드를 참고하면 됩니다. 금리·유동성 환경은 연준 동결·지갑 영향과도 겹칩니다.
- 헤드라인 EPS($9.11)만 보지 말고 본업 EPS·영업이익률을 같이 확인
- Cloud 성장률과 Capex 가이던스·FCF를 한 세트로 읽기
- 다음 실적에서 Q3 검색 성장·외부 용량 비용·마진 코멘트를 체크
- 바스켓(ETF)이면 구글 비중과 엔비디아·메타 등 AI Capex 민감 종목과의 동조를 보기
한줄로 정리
이번 구글 주가 급락은 ‘실적 부진’이 아니라, 클라우드 성적표는 A인데 청구서(Capex)가 더 커진 밤에 가깝습니다. 매출 $119.8B·Cloud +82%는 분명한 호재이고, $9.11 EPS는 지분평가가 부풀린 숫자이며, $195–205B Capex와 FCF 적자가 주가의 발목을 잡았습니다. 앞으로의 승부처는 백로그가 이익으로 바뀌는 속도입니다.
위 내용은 공시·언론 보도를 바탕으로 한 정리이며, 투자 권유가 아닙니다. 매매·비중 결정은 본인 판단과 최신 공시를 기준으로 하시기 바랍니다.
클라우드 성적표는 A였고, Capex 청구서를 시장이 먼저 읽었습니다.
출처
- CNBC — Google Q2 2026 earnings live updates
- Alphabet 8-K / StockTitan filing summary
- Investing.com — earnings call transcript summary
- MarketBeat — GOOG Q2 2026 earnings / transcript
- TradingKey — selloff after EPS beat
- InsiderFinance — preview & analyst targets
- Internal: 2026-07-23-alphabet-q2-earnings-stock-drop-session-01.md
답글 남기기