War Economic Damage 2026 — Iran 6 Months, Ukraine 4 Years: How Far Did GDP Fall?
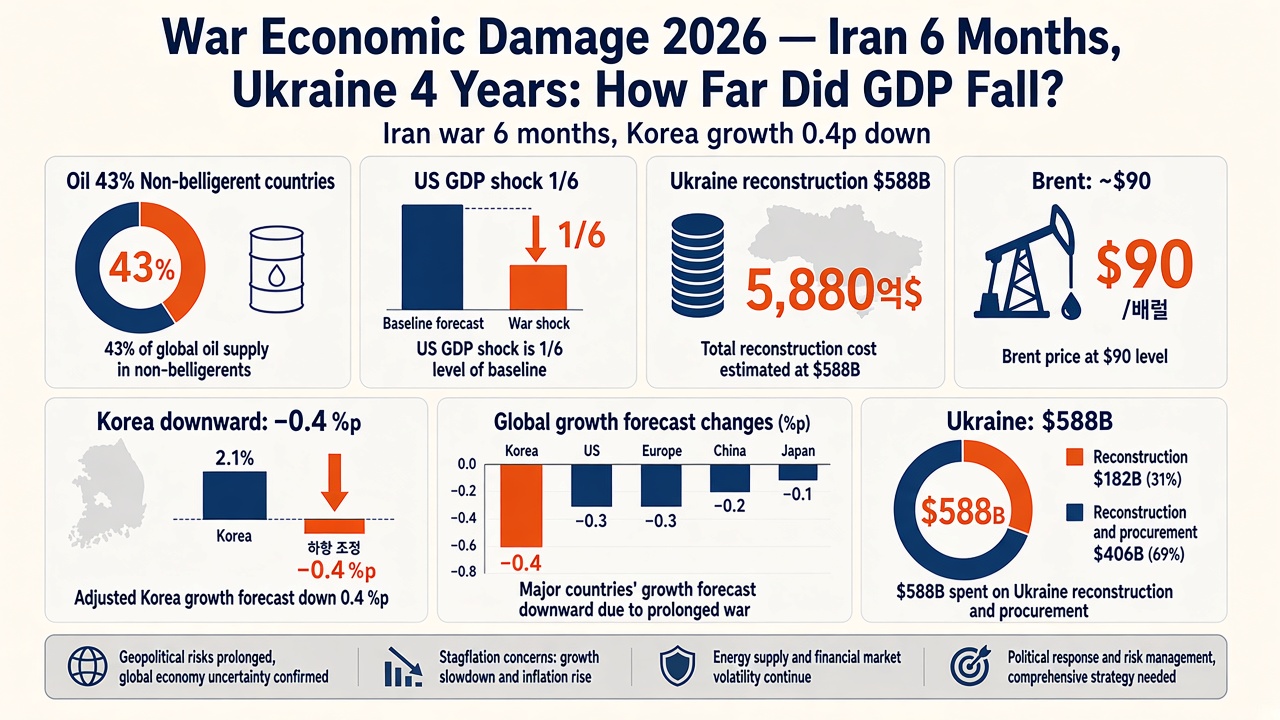
War economic damage is not the same everywhere. On Feb 28, 2026, US–Israeli strikes on Iran began; by Aug 28 that is six months of conflict. With the Strait of Hormuz (the main route for Middle East oil, gas, and fertilizer) effectively closed, Brent crude peaked near $120 in April and is averaging about $90 in 2026 — up from roughly $70 last year.
Ukraine’s war is in its fourth year. The World Bank’s latest RDNA5 puts recovery needs at $588 billion over the next decade. Here we cover (1) how war hits economies, (2) how far the US, Middle East, Korea, China, and Ukraine have retreated, and (3) what to watch next. This is not investment or FX advice.
At a glance — key war-damage numbers
- Oil — conflict-affected countries supply 43%+ of global output (Reuters)
- Prices — Brent 2026 avg ~$90, April peak ~$120
- Global growth — Hormuz closure could cut Q2 2026 growth by 2.9 pp annualized (Dallas Fed)
- Middle East — IMF 2026 growth 0.7% (−1.2 pp vs April), Qatar warned near −30%
- Korea — OECD growth cut 0.4 pp (largest among majors), gasoline +18.3% Feb 28–Apr 20
- Ukraine — direct damage $195.1B, 10-year recovery $588B
War economic damage — 2026 growth forecast cuts by region bar chart. IMF, OECD, Dallas Fed public estimates. * Dashed bars = Hormuz scenario (annualized shock); solid = official forecast cuts.
How war economic damage spreads
The first channel is usually energy. About one-quarter of seaborne oil, one-fifth of LNG, and one-third of fertilizer trade pass through Hormuz. When shipping stops, freight and insurance rise and refineries get less crude — so gasoline, diesel, and jet fuel climb together. The IEA calls this the largest supply disruption in oil-market history.
The second channel is inflation. Energy feeds transport, power, and factory costs. Fertilizer disruptions can push food prices later. US consumers felt pump and grocery prices; in Korea, transport/fuel inflation hit 5.0% in March (KEIA).
The third is GDP growth. Households spend more on fuel and food, so other consumption falls; firms delay investment when margins squeeze. The IMF describes it like a sudden income tax — not that money vanishes, but the same money buys less.
-
1
① War · closure
Hormuz · infra damage
-
2
② Energy
Oil $90–120, LNG, fertilizer
-
3
③ Inflation
Fuel · transport · food ↑
-
4
④ Growth
Consumption · investment · exports
-
5
→ Result
GDP forecasts cut
United States — less shaken than you might expect
Despite direct US involvement, Dallas Fed research finds a 15% global oil supply shock now cuts US real GDP growth by only about 0.3 pp annualized, versus 1.7 pp for the rest of the world — roughly one-sixth the sensitivity.
Two reasons: the US is now roughly a net oil exporter, so higher prices raise energy income and offset some non-oil weakness; and oil’s share of GDP spending is down more than 60% from the 1980s. A similar shock in 1980 could have cut growth by 5.6 pp; today it is about 0.3 pp.
That does not mean no pain — WTI hit $115 in April and consumer sentiment softened. But in GDP terms, war economic damage is far smaller in the US than in Hormuz-dependent importers.
United States
−0.3 pp
Growth hit
Why · Net exporter · lower share
vs 1980 · 1/20 sensitivity
Rest of world
−1.7 pp
Growth hit
Why · Net energy imports
vs US · ~6× larger
Middle East & Gulf — the deepest retreat
The war zone itself retreated the most. The IMF now sees 0.7% growth for the Middle East and Central Asia in 2026, 1.2 pp below April. Iraq, Kuwait, and Qatar face sharp 2026 contractions before a 2027 rebound.
Oxford Economics warns Qatar’s economy could shrink about 30% in 2026 after Ras Laffan damage. JPMorgan estimates Dubai property sales fell 70–80%. Qatar and UAE equities underperformed world stocks by 20+ pp. Saudi exports fell 10% from Q1 to Q2.
Energy exporters outside the conflict zone can gain from higher prices. The IMF notes technology-led exporters also offset some shock. War damage follows geography and energy balances.
South Korea — importer vulnerability
Korea imports about 70% of crude via Hormuz and 94% of energy overall (CSIS). Early in the war KOSPI had its worst session on record and USD/KRW neared 1,500.
The OECD cut Korea’s 2026 growth forecast by 0.4 pp — the largest among major economies. NH Research sees −0.3 pp if the war lasts three months and toward 0% if it lasts a year; oil at $150 could shave another 0.8 pp.
Gasoline rose 18.3% from Feb 28 to Apr 20; Seoul imposed its first fuel price cap in 30 years. Naphtha dependence (~35% from the Gulf) raised semiconductor and petrochemical risks.
By August, Korea’s outlook is not all dark — chip exports led BOK/KDI to upgrade 2026 growth toward 3%. War damage and AI/chip strength overlap in the same year; energy pain remains, but one GDP number does not tell the whole story.
China & other importers
PIIE models China’s 2026 GDP level about 1.8% lower under $120 oil for a year — not only from energy but from weaker export demand as global growth slows.
Low-income importers with thin reserves struggle most. The IMF: large energy imports plus weak tech-chain participation equals the weakest group.
Ukraine — cumulative damage over four years
RDNA5 (Feb 2026): $195.1B direct damage, $666.7B economic and social losses, $588B recovery needs over 10 years — about 3× 2025 nominal GDP. Transport ($96B), energy ($91B), and housing ($90B) lead sector needs.
2026 growth may run 1.0–1.6% (IMF), but the bigger picture is destroyed capital, not one year’s growth rate.
Global retreat — pulling it together
There is no single ‘world GDP fell X%’ line — timing and country mix differ. Useful anchors:
- Short-run growth — Hormuz closed one quarter: ~−0.2 pp on 2026 global growth; two quarters: −0.3 pp; three: −1.3 pp (Dallas Fed)
- IMF global view — 3.0% in 2026, 3.4% in 2027
- Largest regional hit — Gulf war zone (e.g. Qatar ~−30%)
- Importer hit — Korea and similar Asia (0.3–0.4 pp forecast cuts, higher inflation)
- Stock of damage — Ukraine $588B recovery bill
In short: the 2026 Iran/Middle East war is a 0.2–1 pp-class global growth shock; the war zone and energy importers retreated most; the US relatively little; Ukraine’s scar is measured in hundreds of billions of destroyed and missing capital.
What to watch next
- Hormuz — pace of reopening (IMF assumed mid-July start)
- Oil — Brent near $90 vs winter distillate spikes
- Fertilizer & food — Northern Hemisphere planting/harvest pass-through
- Korea — fuel cap exit, naphtha/LNG buffers, chips vs energy
- Ukraine — energy infrastructure hits and Western aid flows
Related: USD/KRW breaks 1,500, BOK hike · FX · housing, US market · DXY, KOSPI outlook · US/Taiwan/Japan. Educational only — not advice.
War damage is not one global percent — it follows who imports energy and who sits on the chokepoint.
Sources
- Reuters — six months of Iran war, oil flows
- IEA — Middle East and global energy markets
- Dallas Fed — Hormuz closure and global GDP
- Dallas Fed — US vs world oil shock sensitivity
- IMF — energy, trade, finance channels
- AGBI / IMF — Middle East growth 0.7%
- The Business Standard — six months of war
- CSIS — Iran conflict impact on South Korea
- Korea Times / NH — Korea growth scenarios
- World Bank — Ukraine RDNA5
- PIIE — global implications of 2026 Middle East war
- Internal: 2026-08-29-us-war-economic-damage-session-01.md
For information only — this is not a recommendation to buy or sell any asset.
Comments 0