IMF October WEO: Three Things Korea’s Growth Forecast Won’t Tell You
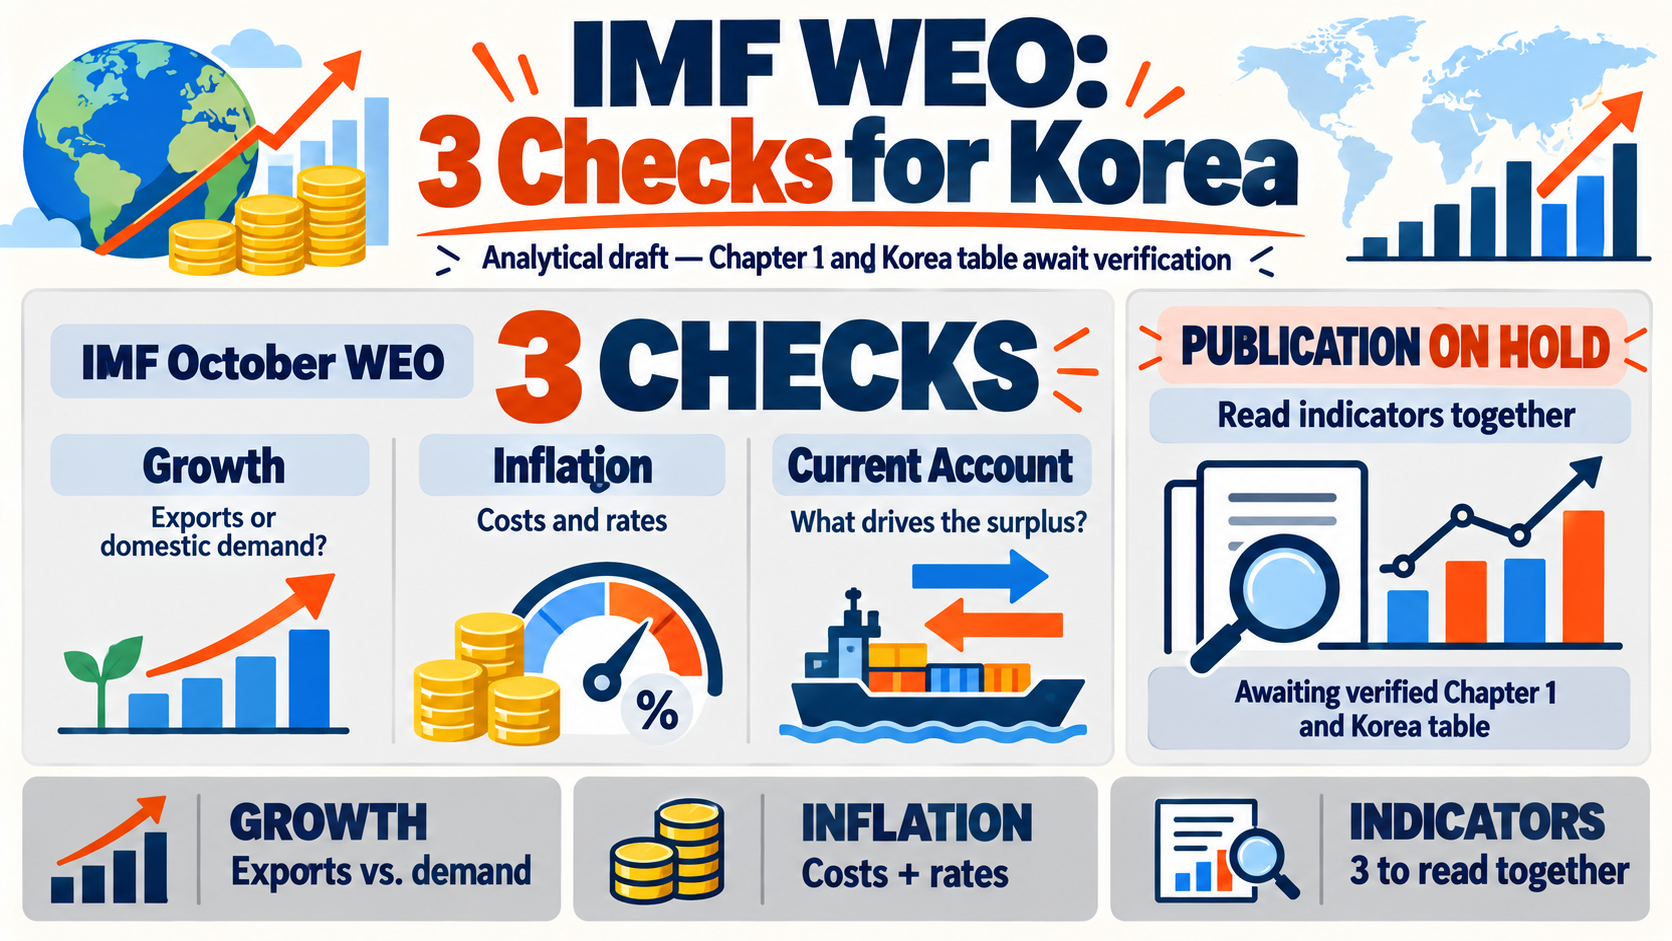
What is Korea’s growth forecast in the IMF October WEO? As checked on October 13, 2026, the official page still says Coming Soon, so the new figure cannot yet be verified. Growth needs to be read alongside inflation and the current account: rising output may not translate into better earnings or stock prices when costs and financing expenses rise faster. Source: IMF WEO 공개 상태
The IMF schedules the WEO press briefing for October 13 at 9 a.m. in Bangkok, or 11 a.m. in Korea. A scheduled date is not proof that forecast tables are already available. Korea’s projections for this year and next, including revisions, remain unverified. Source: IMF 연차총회 일정
IMF WEO: Why Inflation Belongs Beside the Growth Forecast
Real GDP growth measures output after removing price changes. Company revenue depends on both quantities and prices. Higher export prices can lift sales without an equivalent increase in real output or domestic consumption. That distinction matters when translating a Korean GDP forecast into an earnings view.
The reason for higher inflation matters. Price increases supported by stronger demand differ from increases forced by imported energy costs. In the latter case, costs may outpace revenue, while households reduce discretionary spending to pay essential bills. The following mechanism is our economic interpretation, not a claim about revisions in the forthcoming report.
-
1
Import costs
Energy prices and FX
-
2
Costs and prices
Margins depend on pass-through
-
3
Purchasing power
Essentials can crowd out discretionary spending
-
4
Investment and jobs
Adjust to demand and cash availability
A single global growth number cannot rank industries. Firms able to pass through costs differ from suppliers locked into fixed-price contracts. Exporters also depend on customers’ investment plans and the durability of orders. Even an upward Korean growth revision would require a breakdown before drawing conclusions about consumption and employment.
Georgieva, Waller and the BOK: Why Better Growth Need Not Mean Rate Cuts
In her October 7 curtain-raiser, IMF Managing Director Kristalina Georgieva discussed AI investment, high energy prices and public debt together, emphasizing inflation control and credible fiscal adjustment. These are pre-release policy themes, not newly verified Chapter 1 forecasts. Source: 게오르기에바 10월 7일 연설
Federal Reserve Governor Christopher Waller said on October 8 that employment had stabilized while inflation progress remained inadequate. The Bank of Korea’s August 27 policy decision also considered inflation and financial stability. Better growth prospects therefore do not automatically imply lower policy rates. Source: 월러 10월 8일 연설
The BOK decision is available through KDI’s official republication. The October 13 Governor Talks announcement describes a planned discussion of low inflation, exchange-rate flexibility and financial stability. An agenda is not a delivered speech or a new rate decision. Source: 한국은행 통화정책방향·KDI 재게시
The planned discussion still requires a verified transcript. Our earlier FOMC minutes and Korean financing costs article provides the rate-policy background. The distinct task for this WEO is to test whether its growth-inflation combination is consistent with those financing assumptions. Source: 한국 총재 대담 안내
Three Easy-to-Confuse Items in Korea’s Table: Year, Inflation Measure, Surplus Driver
First, match the forecast year and comparison baseline. A stronger current year alongside a weaker next year can imply a different investment outlook. Read both the projected level and its revision, and account for publication dates and assumptions when comparing IMF and BOK forecasts.
Second, check the inflation definition. Annual-average consumer-price inflation differs from year-end inflation. The former describes prices across the year; the latter captures the pace near its end. Mixing the measures can distort the apparent disinflation trend.
Third, ask what drives the current-account surplus. It combines goods and services trade with income and transfers. A larger surplus can reflect stronger exports or weaker imports as domestic spending retreats. These alternatives carry different messages for domestically focused companies. We covered the export side separately in September’s export surge and its sector split.
Export-led
Stronger foreign demand
Driver
Check · Transmission to capex and jobs
Import compression
Potentially weaker domestic demand
Driver
Check · Consumption and capital-goods imports
The current account is a flow; the net international investment position is a stock of external assets minus liabilities. A surplus does not guarantee won appreciation, and national net assets do not imply that every company has dollar liquidity. Ownership, currencies and repayment dates matter.
An ex-ante real rate can be approximated by subtracting expected inflation from a nominal rate over the same horizon. Subtracting next year’s annual-average WEO inflation from today’s policy rate can mismatch periods. We have not verified a Korean real-rate series in this release and do not manufacture one.
Why Earnings and Equity Prices Can Diverge
Earnings depend on volumes, prices, costs and interest expenses. Equity prices also incorporate the discount rate used to value future income today. Better earnings can coexist with lower prices if investors demand a sufficiently higher return. A GDP revision cannot be mechanically converted into a KOSPI target.
Financing capacity can also shape industry structure. Firms with durable demand and internal cash can continue investing, while suppliers left with little cash after interest payments may postpone expansion. Over time, that can widen capacity and bargaining-power gaps. This is conditional analysis, not evidence of a particular company cutting investment.
CNN’s Fear & Greed Index, a 0–100 gauge of US equity sentiment, stood at 45.5, neutral, on October 12 UTC. It is up 1.8 points from 43.7 a week earlier and 12.9 points from 32.7 a month earlier. Anxiety has eased, but the not-yet-published WEO cannot yet confirm that optimism. The relevant comparison is between expectations already priced and the actual report. Source: CNN 제공 스냅샷
GoldKimp’s KOSPI indicator was 61.8, greed, on October 6. Its classification is more optimistic than the US reading, but differing dates and methods prevent precise score comparisons. Prior-week and prior-month KOSPI observations are unavailable. SentimenTrader’s public page displayed neither Smart Money nor Dumb Money values or dates, so we cannot assess their relative confidence. Source: GoldKimp 제공 스냅샷
Smart Money and Dumb Money are SentimenTrader indicator labels, not judgments of an investor’s ability. With no verified readings available here, they provide no directional signal for this article. Source: SentimenTrader 확인 시도
The First Numbers to Check Once the Report Is Out
Compare world and Korean growth forecasts for 2026 and 2027, the definition of Korean inflation, and current-account projections from the same edition. Then read Chapter 1 for the demand drivers behind those figures. Distinguish the report’s policy recommendations from the Managing Director’s earlier speech.
Chapter 1 and Korea’s forecast table could not be retrieved from the official page checked on October 13. The direction of the new forecast revision therefore remains unverified. Once the table is available, the key is how much growth reaches corporate earnings and household income. Higher financing costs can change the market response even when the earnings outlook improves. This article does not recommend a specific trade.
Sources and references
- IMF — October 2026 WEO, Coming Soon
- IMF — 2026 Annual Meetings schedule
- Kristalina Georgieva — 2026-10-07 Curtain Raiser
- Christopher Waller — 2026-10-08 speech
- 한국은행 — 2026-08-27 통화정책방향, KDI 재게시
- IMF — 2026-10-13 Korea Governor Talks
- CNN Fear & Greed — 제공 스냅샷 2026-10-12
- GoldKimp KOSPI — 제공 스냅샷, 관측일 2026-10-06
- SentimenTrader — 공개 페이지 확인 시 수치 미표시
For information only — this is not a recommendation to buy or sell any asset.
Comments 0