US consumption rose 0.6%, real income stalled — how long can spending last?
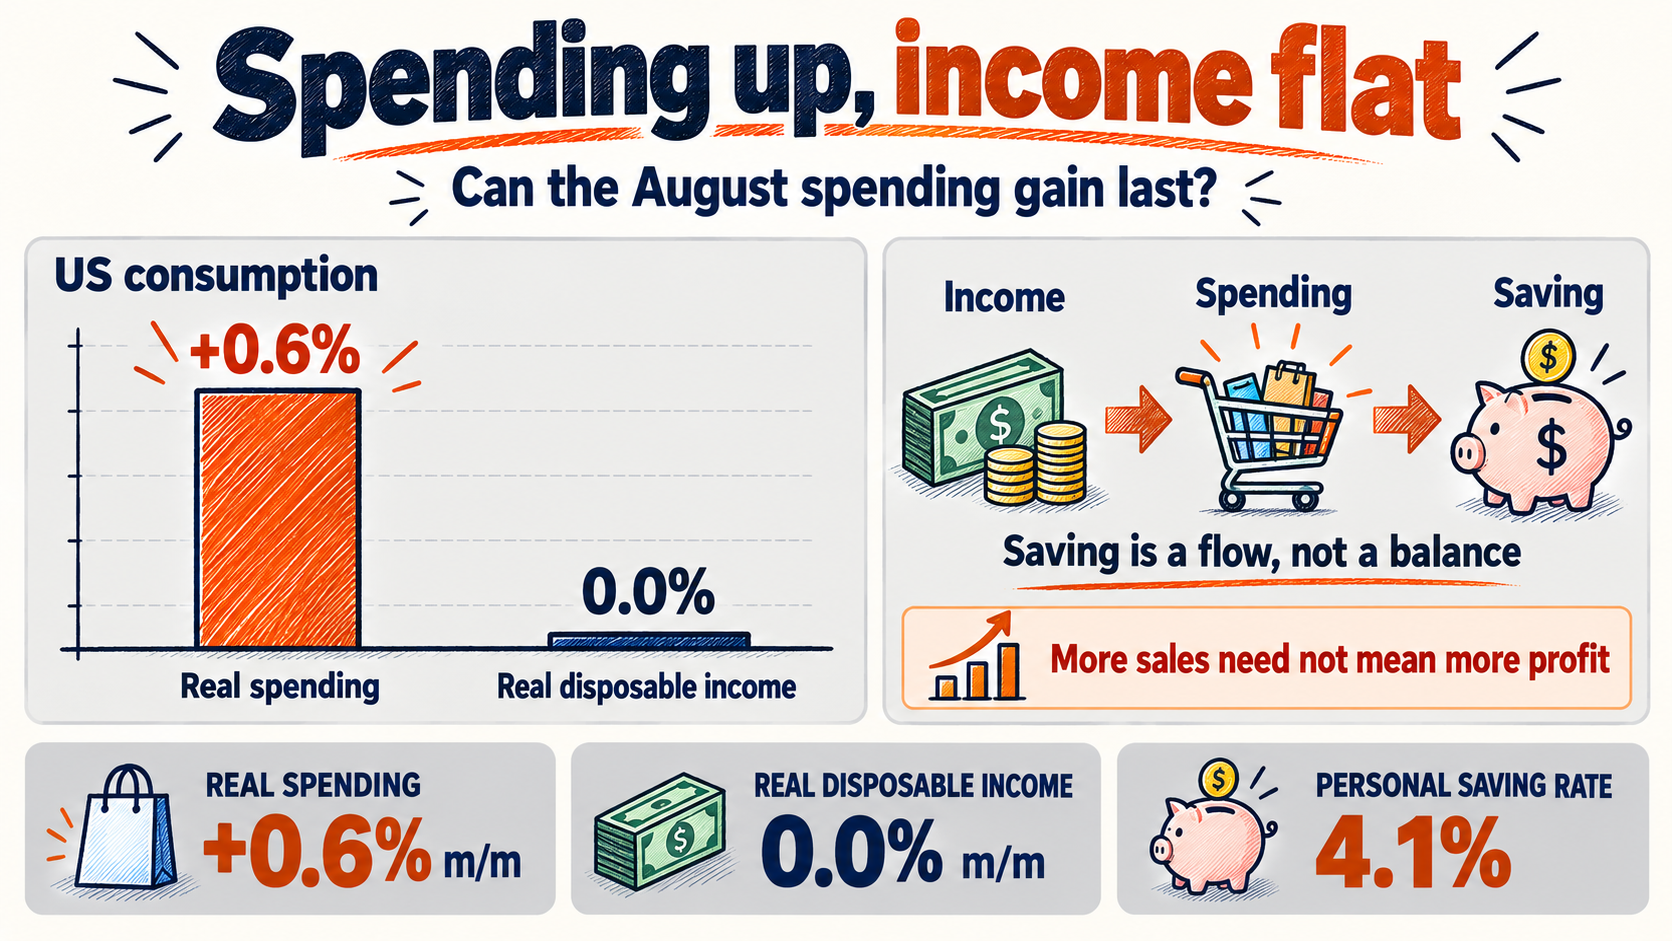
US consumption rose in August, but inflation-adjusted disposable income did not. The BEA’s September 30 release reported real spending up 0.6% from July, flat real disposable income and a 4.1% saving rate. Stronger sales and stronger spending capacity are different things. Source: Source
For Korean car and appliance makers, stronger demand is welcome. But if discounts or subsidized financing enabled a purchase, additional sales may bring much less additional profit. So where did the money come from? This report establishes neither a consumer collapse nor a durable boom.
US consumption: why 0.6% spending and flat income belong together
Disposable income is income after personal taxes; real disposable income adjusts that amount for prices. Nominal disposable income rose 0.3%, alongside a 0.3% rise in the PCE price index. The rounded real change was therefore zero: more dollars did not buy meaningfully more goods and services. Source: Source
Spending behaved differently: it increased 0.6% even after adjusting for prices. The chart compares monthly real growth rates only. The 4.1% saving rate is a share of income, not another growth rate.
August income and spending growth. BEA, September 30. Income means disposable income. The saving rate uses a different denominator.
Compensation and government social benefits contributed to income growth. That does not mean every household received the same raise. Aggregate income combines multiple sources, and the households earning more need not be those spending more. Source: Source
A 4.1% saving rate is not a bank balance
The saving rate measures the share of income left after personal outlays during a period. BEA outlays include consumption, personal interest payments and current transfers. It is not simply 100 minus consumption’s share of income. Source: Source
A positive rate means aggregate saving remained positive during the period. It does not establish widespread withdrawals. Some households may save less each month, others may sell assets or borrow. This aggregate release does not identify how much each channel contributed.
Consider an illustration with stable prices and no other outlays. A household earning 100, spending 95 and saving 5 can raise spending to 96 by saving only 4. Income need not rise immediately. Repeating the adjustment, however, requires room to save less.
-
1
Income stays 100
Stable prices; no other outlays
-
2
Saving 5 → 4
Less new saving during the month
-
3
Spending 95 → 96
Possible without withdrawing deposits
The next question is whether real income catches up, whether spending strength is concentrated among asset owners, and whether households can withstand an employment setback. A single monthly gap is insufficient evidence of a consumption crisis.
Stocks push spending, rates pull back: Waller and the FOMC
In his September 3 speech, Fed Governor Christopher Waller expected higher equity wealth to support consumption. Wealth gains can make purchases feel more affordable without immediately increasing income; households with little equity exposure benefit less. Source: Source
Waller added that his rate decision would depend on continued progress on inflation. About two weeks later, on September 16, the FOMC raised its target range by 0.25 percentage points to 3.75–4.00%, citing resilient domestic spending and elevated inflation. New loan costs can rise, though pricing also depends on credit quality, maturity and lender competition. Source: Source
As of October 1, CNN’s Fear & Greed Index stood at 28.1, in the fear range, down 7.7 points from 35.7 a week earlier and 16.8 from 44.9 a month earlier. Persistent investor caution could temper large purchases supported by wealth. The index alone cannot predict a decline in consumption. Source: Source
GoldKimp’s September 30 KOSPI reading was 59.3, or greed. The mood differs from the US, but different methodologies prevent a direct numerical comparison. The available Korean data lack week- and month-earlier comparisons, so the direction is unclear. With Korean sentiment in greed despite concerns about US spending, expectations for car and appliance stocks exposed to US demand could run ahead of earnings. As of October 2, SentimenTrader’s public page displayed neither current Smart Money and Dumb Money readings nor their date. Source: Source
Hyundai sales fell, hybrids rose 33% — watch auto and appliance margins
Hyundai’s September 1 company release illustrates the distinction: August US sales were 86,977, down 2% year over year, while hybrids rose 33%. North America CEO Randy Parker cited hybrid demand and a difficult comparison involving earlier EV purchases and Labor Day timing. One demand headline cannot explain every vehicle segment. Source: Source
Hyundai reports year-over-year units; BEA reports month-over-month real expenditure. The growth rates are not directly comparable. The useful lesson is the importance of product mix and comparison periods. For Hyundai and Kia, watch discounts per vehicle, financing support and inventory duration alongside volume.
Discounting can protect factory utilization while reducing profit per vehicle if component and labor costs remain unchanged. A richer mix of vehicles sold without discounts can improve profitability even with modest volume growth. The next earnings release will help show how August sales translated into profit.
LG’s July 30 results described a premium-and-volume appliance strategy, cost and supply-chain improvements, and a one-time US tariff refund benefit. These are global results, not direct evidence of strong US household demand. They illustrate why appliance earnings should be separated into demand, product mix, costs and nonrecurring items. Source: Source
Supported by income
Recurring purchasing capacity
Consumer
Producer · Potential full-price sales
Investment · Repeat orders support capacity
Dependent on incentives
Pull-forward may not repeat
Consumer
Producer · Financing and discount costs
Investment · Need durable orders, lean stocks
A broken refrigerator may need immediate replacement; a working one can wait. That distinction matters for Samsung and LG in the US. Housing turnover and move-ins can support new appliance purchases, while housing costs can squeeze replacement budgets. Our earlier article on Related: US housing starts and builder discounts adds context.
Investment needs repeat orders and sustainable inventory reduction, not one strong sales month. Firms able to adjust local production and product mix have more flexibility; suppliers with dedicated equipment may be more exposed to a weak model or category. The cost differences discussed in our article on Related: US fuel-economy rules and auto/battery margins interact with affordability.
What keeps spending going: real income, durables mix, revisions
First, real disposable income. Employment and wage gains combined with slower price increases would allow spending to grow without further reducing saving. If essentials become more expensive faster than income grows, postponable purchases face pressure. Recovering purchasing power is central to durability.
Second, composition. Strong services spending does not guarantee stronger car or appliance sales. Compare real durable-goods spending with company sales and promotion costs. Local production, exchange rates and cost structures determine how US demand translates into Korean exports and won-denominated profit.
Third, several months of data on a consistent revision basis. This release incorporates annual revisions beginning in 2021. Mixing old-release figures with revised observations can distort the trend. The next personal income and outlays release is scheduled for October 29 at 8:30 a.m. Eastern time. Source: Source
The more useful question comes after how much Americans bought: is income growing enough to fund the next purchase, and are companies earning a margin on it? Improvement in both would give consumption a better chance of supporting investment and employment. This is economic analysis, not an investment recommendation.
Watch the income that sustains spending and the margin that sales leave behind.
Sources
- BEA — Personal Income and Outlays, August 2026
- Federal Reserve — September FOMC statement
- Christopher Waller — Economic Outlook
- Hyundai Motor America — August 2026 Sales
- LG Electronics — Second-Quarter 2026 Results
- CNN Fear & Greed
- GoldKimp KOSPI Fear & Greed
- SentimenTrader — Smart/Dumb Money Confidence
For information only — this is not a recommendation to buy or sell any asset.
Comments 0