OPEC+ 11월 쿼터 동결 — 생산 목표와 실제 공급이 다른 이유OPEC+ Holds November Quotas: Why Oil Supply Still Falls Short
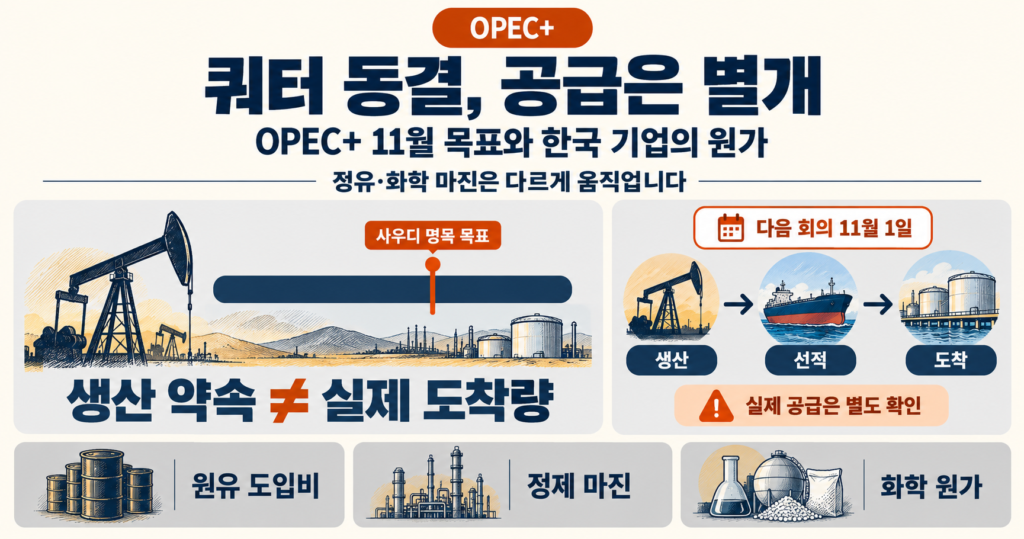
OPEC+ 7개국이 11월 원유 생산 쿼터를 9월 수준으로 동결했습니다. 그렇다고 한국에 들어오는 기름의 양과 가격까지 그대로라는 뜻은 아닙니다. 이번 결정은 ‘생산하기로 합의한 양’과 ‘실제로 운송할 수 있는 양’을 나눠 봐야 읽힙니다. 이 차이는 정유사의 이익, 화학사의 원가, 가계의 생활비로 각각 다르게 이어집니다. 특정 종목의 매수·매도를 권하는 글은 아닙니다. 출처: OPEC, 2026-10-04: 7개국 11월 생산 목표
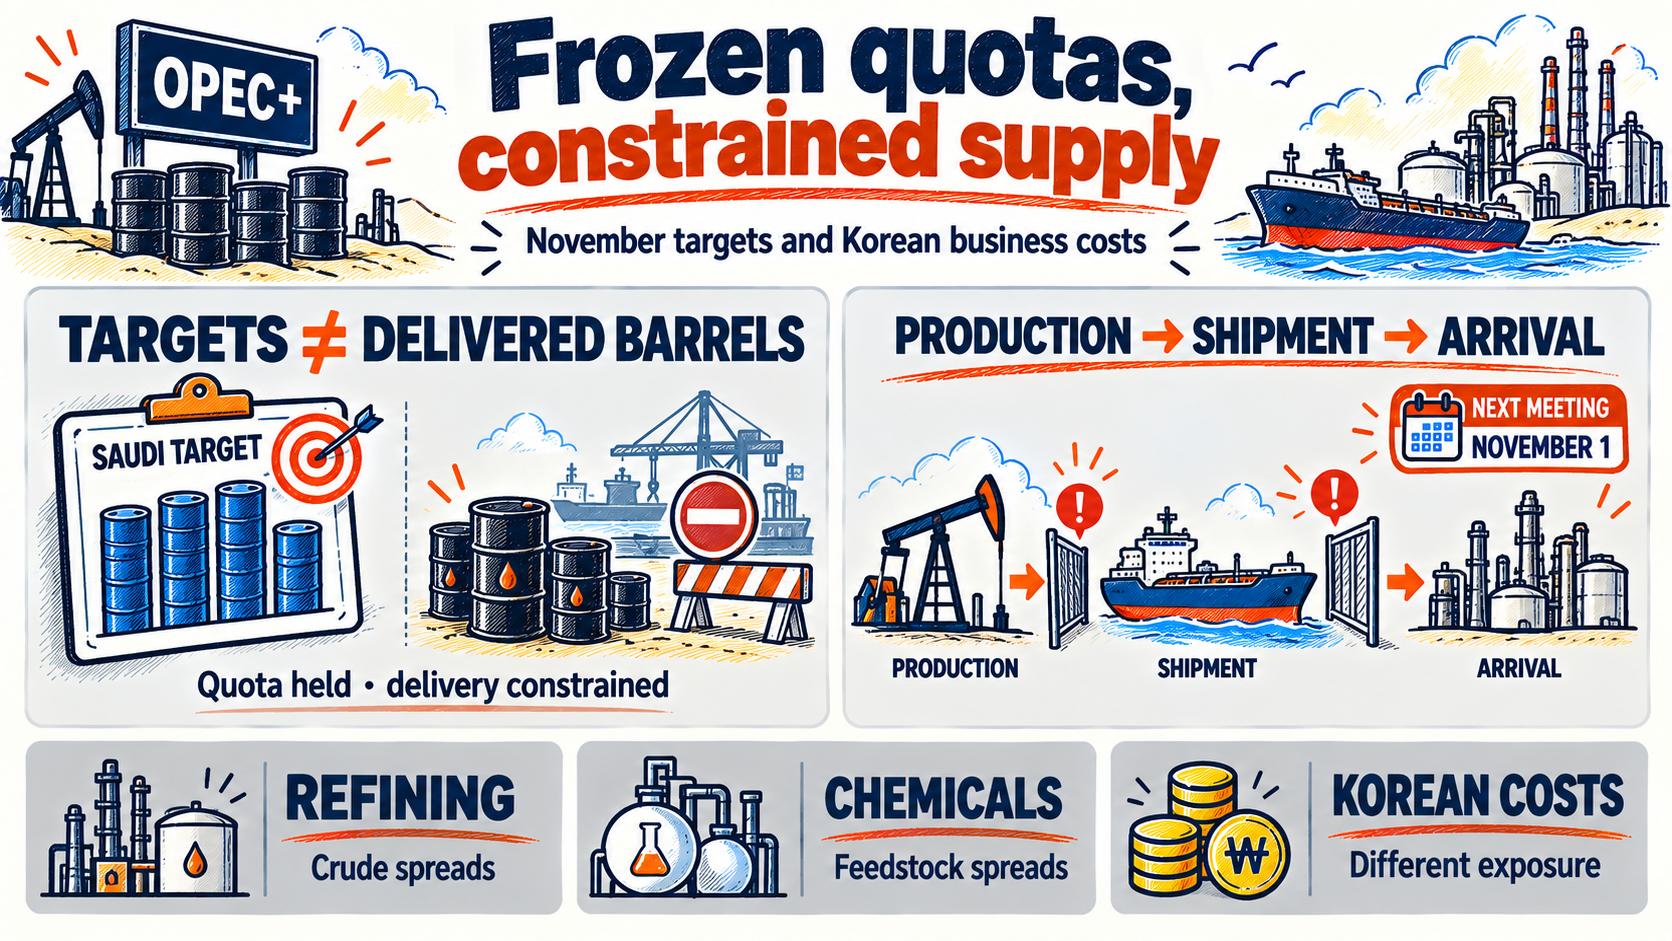
Seven OPEC+ members have frozen November oil quotas at September levels. That does not freeze the amount or price of oil reaching Korea. The distinction between agreed production and oil that can actually be delivered explains why refiners, chemical producers and households can face very different outcomes. This is not a recommendation to buy or sell any security. Source: OPEC, 2026-10-04: 7개국 11월 생산 목표
OPEC+가 실제로 동결한 것: 7개국의 11월 생산 목표
10월 4일 화상회의에 참여한 나라는 사우디아라비아·러시아·이라크·쿠웨이트·카자흐스탄·알제리·오만입니다. OPEC 공식 발표는 이 7개국의 11월 요구 생산량을 9월 수준으로 유지한다고 밝혔습니다. OPEC+ 전체 산유국의 모든 생산을 한꺼번에 동결했다는 발표는 아닙니다. 다음 회의는 11월 1일입니다. 출처: OPEC, 2026-10-04: 7개국 11월 생산 목표
사우디의 기준은 하루 1,047.8만 배럴입니다. 영문 자료의 10,478천 배럴을 환산한 수치입니다. 국가별 표를 전재한 The Edge 보도에서 확인한 숫자이며, 사우디가 지금 그만큼 생산하거나 수출한다는 뜻으로 읽으면 안 됩니다. 공식 발표 본문에서는 동결 결정을 직접 확인했지만 국가별 표는 텍스트로 추출되지 않았습니다. 출처: The Edge, 2026-10-05: OPEC 국가별 쿼터 전재 출처: OPEC, 2026-10-04: 7개국 11월 생산 목표
쿼터는 산유국 사이의 생산 약속입니다. 반면 셧인(shut-in)은 시설 손상이나 운송 차질 등으로 생산을 멈춰 놓은 상태를 말합니다. 약속한 양을 늘려도 시설과 수송로가 막혀 있으면 추가 원유가 나오지 않습니다. 반대로 목표가 그대로여도 멈춘 시설과 항로가 복구되면 실제 공급은 늘 수 있습니다.
호르무즈를 통과하는 양과 세계 공급 부족은 다릅니다
국제에너지기구(IEA)의 9월 보고서는 8월 걸프 지역에서 하루 1,000만 배럴 이상의 생산이 멈춰 있었다고 추정했습니다. 이는 8월 상태를 설명하는 수치입니다. 10월 4일 현재의 셧인 규모로 옮겨 쓰거나 사우디의 11월 쿼터에서 빼면 시점과 대상이 뒤섞입니다. 출처: IEA, 2026-09-11: Oil Market Report
IEA 석유산업·시장 부문 책임자 토릴 보소니는 9월 18일 해설에서 8월 호르무즈 통과량이 하루 760만 배럴로 전쟁 전보다 1,310만 배럴 적었다고 설명했습니다. 다만 우회 항로, 다른 지역의 증산, 재고 방출과 소비 감소가 일부를 메웠습니다. 해협 통과량 감소 전부를 세계의 순공급 부족으로 계산할 수 없는 이유입니다. 출처: IEA Toril Bosoni, 2026-09-18: 중동 공급 부족
-
1
생산 목표
국가 간 합의
-
2
실제 생산
시설·저장 제약
-
3
선적·항해
항로·보험·운임
-
4
한국 도착
납기·조달 비용
10월 4일 블룸버그 보도도 사우디·이라크·쿠웨이트의 생산이 전쟁 전 수준에 크게 못 미친다고 전했습니다. 따라서 이번 동결은 물리적 공급이 정상화됐다는 신호로 보기 어렵습니다. 다만 이 자료들만으로 10월의 정확한 부족량이나 유가 목표치를 계산할 수도 없습니다. 출처: Bloomberg / World Oil, 2026-10-04: 생산 목표 동결
한국 구매자가 확인할 것은 생산 발표 다음 단계입니다. 원유를 선박에 실을 수 있는지, 보험을 확보할 수 있는지, 약속한 날짜에 도착하는지가 중요합니다. 더 먼 산지에서 대체 원유를 구하면 같은 양을 확보해도 운임과 운송 기간이 늘어날 수 있습니다. 원유마다 성분이 달라 정유설비에서 얻는 제품 비중도 달라집니다.
정유사는 제품 차익, 화학사는 원료비 전가를 봅니다
유가가 오르면 정유사가 무조건 이익을 보는 것은 아닙니다. 정유사는 원유를 사서 휘발유·경유 등을 팝니다. 제품 판매가격에서 원유 비용을 뺀 차이를 흔히 정제 마진이라고 부릅니다. 실제 영업이익에는 여기에 운임, 에너지 사용료, 설비 운영비와 가동률까지 반영됩니다.
제품 부족으로 경유 가격이 원유보다 더 오르면 차익이 넓어질 수 있습니다. 그러나 비싸진 원유를 확보하지 못해 설비를 덜 돌리면 판매량이 줄고 제품 한 단위당 고정비가 커집니다. IEA는 8월 대서양권 정제 마진이 강했던 반면 운임 급등은 싱가포르의 수익성에 부담이었다고 설명했습니다. 같은 유가라도 지역과 조달 경로에 따라 결과가 달랐다는 사례입니다. 출처: IEA, 2026-09-11: Oil Market Report
화학사는 다른 계산을 합니다. 나프타는 원유를 정제해 얻는 석유화학 원료이며 한국 업체는 이를 수입하거나 국내 정유사에서 조달합니다. 이를 분해해 플라스틱의 기초 원료 등을 만듭니다. 나프타 값이 올라도 완성품 주문이 약하면 판매가격을 같은 폭으로 올리기 어렵습니다. 제품 가격과 원료 가격 사이의 차이가 줄어드는 것입니다.
정유
제품 가격이 원유보다 더 상승
기회
위험 · 조달 차질·운임·가동률 하락
석유화학
나프타 비용을 판매가에 반영
조건
위험 · 수요 약화·제품 차익 축소
아래 비교는 기업별 실적 전망이 아니라 비용이 전달되는 구조입니다. 원료 구매 계약, 제품 구성, 환율을 미리 고정하는 거래에 따라 실제 결과가 달라집니다. 정유·화학·플라스틱의 수출액이 늘어도 단가 상승 때문인지 물량 증가 때문인지 나눠 봐야 합니다. 달러 매출 증가만으로 이익 개선을 판정하기 어렵습니다.
설비 투자에서도 차이가 생길 수 있습니다. 조달 여력이 큰 기업은 원료선 다변화나 저장시설에 투자할 유인이 생깁니다. 반대로 원가를 전가하기 어려운 업체는 현금이 재고 구입에 더 묶여 증설을 미룰 수 있습니다. 공급 충격이 오래가면 산업의 경쟁력은 생산능력뿐 아니라 조달과 자금 여력에서도 갈릴 수 있다는 해석입니다.
유가에 환율이 더해지면 생활비는 어떻게 달라질까
한국 기업의 원화 원유 비용은 대략 달러 원유가격에 원·달러 환율을 곱한 값에서 출발합니다. 설명을 위해 달러 유가가 10% 오르고 환율도 5% 상승한다고 가정하면, 원화 환산 원유 비용은 15%가 아니라 15.5% 늘어납니다. 1.10에 1.05를 곱하기 때문입니다. 현재 시세나 전망이 아닌 계산 예시입니다.
원화 원유 비용의 계산 예시. 다른 조건 동일. 1.10×1.05=1.155. 현재 가격·소매가격·물가 전망이 아닙니다. · 축이 0이 아니라 93에서 시작합니다
이 계산을 주유소 가격이나 소비자물가 상승률에 그대로 적용하면 안 됩니다. 소매가격에는 세금, 유통비용, 재고 매입 시점이 함께 들어갑니다. 기업은 비용을 당장 판매가에 반영하거나, 마진으로 흡수하거나, 생산을 줄일 수 있습니다. 가계가 연료비에 더 쓰면 다른 소비를 줄일 여지도 생깁니다.
전기요금은 한 단계를 더 거칩니다. 원유 쿼터가 국내 전력요금을 직접 정하지는 않습니다. 중동 수송 차질은 LNG 조달에도 영향을 줄 수 있고, 일부 가스 계약은 유가와 시차를 두고 연동됩니다. 하지만 발전 연료 구성, 계약 조건과 요금 결정에 따라 반영 속도가 달라집니다. 요금 동결은 비용의 소멸이 아니라 전력회사의 부담으로 남을 수도 있습니다.
앞서 다룬 국제유가와 한국 경제의 비용 전달을 이번에는 생산·수송 단계까지 거슬러 살펴본 셈입니다. 지원 정책이 가계 부담을 늦출 때 누가 비용을 떠안는지는 에너지 지원금의 설계와도 이어집니다.
공급 충격이 금리와 주식시장 심리를 함께 흔드는 이유
보소니가 9월 18일 제시한 조건은 분명합니다. 걸프 공급 제약과 상업 재고 감소가 이어지면 가격 상승과 추가적인 수요 감소가 수급을 맞추는 과정이 될 수 있다는 설명입니다. 경기가 약해져 기름을 덜 쓰더라도 공급이 더 줄면 가격 부담이 남을 수 있습니다. 유가 상승을 곧바로 세계 경기 호황의 증거로 읽기 어려운 이유입니다. 출처: IEA Toril Bosoni, 2026-09-18: 중동 공급 부족
피에르올리비에 구랭샤 IMF 수석 이코노미스트는 4월 14일 분석에서 중앙은행이 에너지 가격 충격을 일시적 현상으로 넘겨볼 수 있는 조건으로 기대인플레이션의 안정을 들었습니다. 기대인플레이션은 사람들이 앞으로 물가가 얼마나 오를 것으로 보는지를 뜻합니다. 이는 10월 회의에 대한 새 발언이 아니라 이번 상황을 이해하는 과거의 분석 틀입니다. 출처: IMF Pierre-Olivier Gourinchas, 2026-04-14: 전쟁과 정책
이 틀을 한국에 적용하면 물가 부담과 경기 둔화가 동시에 나타날 수 있습니다. 에너지 가격 상승이 임금과 서비스 가격에 오래 번지면 금리 인하가 어려워질 수 있지만, 소비와 투자가 위축되면 반대 압력도 생깁니다. 이는 조건부 해석입니다. 이번 동결을 근거로 연준이나 한국은행의 다음 결정을 단정할 수는 없습니다.
주식시장의 분위기도 같은 방향은 아닙니다. CNN 공포·탐욕 지수는 10월 5일 18:00 UTC 기준 43.8로 공포 구간입니다. 전주 34.4보다 9.5포인트 회복했지만 전월 45.2보다는 1.4포인트 낮습니다. GoldKimp의 KOSPI 지수는 10월 1일 기준 60.5로 탐욕입니다. 날짜와 산식이 달라 두 점수를 같은 자로 잰 수치로 보면 안 되며, 한국의 전주·전월 비교값은 확보하지 못했습니다. 출처: CNN Fear & Greed — 2026-10-05 스냅샷 출처: GoldKimp KOSPI F&G — 2026-10-01
SentimentTrader의 Smart Money·Dumb Money Confidence는 10월 6일 공개 홈페이지를 직접 확인했지만 두 수치와 기준일이 표시되지 않았습니다. 따라서 어느 쪽이 더 낙관적인지는 판단에서 제외합니다. 미국의 단기 심리 회복이나 한국의 탐욕 점수가 원유 도착량 증가를 뜻하지는 않습니다. 원가 부담이 실적에 반영되면 낙관적인 주가와 기업 이익 사이의 간격이 다시 조정될 수 있습니다. 출처: SentimentTrader 공개 홈페이지
11월 1일까지 무엇을 확인하면 될까
첫째는 생산 목표보다 실제 선적과 도착량입니다. 쿼터가 그대로인데도 항로가 열리고 원유가 제때 도착한다면 비용 부담이 완화될 여지가 있습니다. 반대로 생산 발표가 늘어도 운임·보험료가 높고 도착이 지연되면 한국 기업이 체감하는 공급은 개선되지 않을 수 있습니다.
둘째는 정유 제품과 화학 원료의 가격 차이입니다. 경유 판매가격과 원유 매입 비용의 차이, 화학 제품 가격과 나프타 비용의 차이를 각각 확인해야 합니다. 셋째는 재고와 수요입니다. IEA의 9월 전망은 올해 세계 석유 수요가 하루 250만 배럴 감소할 것으로 봤습니다. 이 전망대로 수요가 약해져도 공급 회복이 늦으면 비용 압박이 곧장 사라지지는 않습니다. 출처: IEA, 2026-09-11: Oil Market Report
이번 OPEC+ 결정에서 기업 실적을 가르는 질문은 구체적입니다. 필요한 원유를 확보했는지, 얼마에 들여왔는지, 제품 가격에 얼마나 반영했는지입니다. 11월 1일 회의의 새 숫자와 함께 이 세 가지를 확인해야 한국 기업과 소비자에게 실제로 무엇이 달라졌는지 알 수 있습니다.
출처와 참고자료
- OPEC, 2026-10-04: 7개국 11월 생산 목표
- IEA, 2026-09-11: Oil Market Report
- IEA Toril Bosoni, 2026-09-18: 중동 공급 부족
- Bloomberg / World Oil, 2026-10-04: 생산 목표 동결
- Reuters / Yahoo Finance, 2026-10-04: 회의 전 보도
- The Edge, 2026-10-05: OPEC 국가별 쿼터 전재
- IMF Pierre-Olivier Gourinchas, 2026-04-14: 전쟁과 정책
- CNN Fear & Greed — 2026-10-05 스냅샷
- GoldKimp KOSPI F&G — 2026-10-01
- SentimentTrader 공개 홈페이지
- Profile, 2026-10-04: 국가별 11월 쿼터 교차확인
What OPEC+ actually froze: seven countries’ November targets
The October 4 meeting involved Saudi Arabia, Russia, Iraq, Kuwait, Kazakhstan, Algeria and Oman. Their November required production will remain at September levels. This is a decision by seven participants, not a freeze on every barrel produced across the entire alliance. They meet again on November 1. Source: OPEC, 2026-10-04: 7개국 11월 생산 목표
Saudi Arabia’s target is 10.478 million barrels per day, or 10,478 thousand barrels. This figure comes from The Edge’s reproduction of the country table. It is neither current Saudi production nor exports. The official release confirms the freeze, although its country table was not available in the extracted text. Source: The Edge, 2026-10-05: OPEC 국가별 쿼터 전재 Source: OPEC, 2026-10-04: 7개국 11월 생산 목표
A quota is an agreed production target. A shut-in is output halted by constraints such as damaged facilities or disrupted transport. Raising a target cannot repair a terminal. Equally, output can recover under an unchanged target when facilities and routes reopen.
A shipping shortfall is not the same as a global supply deficit
The IEA’s September report estimated that more than 10 million barrels a day of Gulf output remained shut in during August. This is an August estimate, not an October 4 reading. Subtracting it from Saudi Arabia’s November target would mix dates and geographic coverage. Source: IEA, 2026-09-11: Oil Market Report
In a September 18 commentary, Toril Bosoni, head of the IEA’s Oil Industry and Markets Division, put August Hormuz flows at 7.6 million barrels a day, 13.1 million below pre-war levels. Bypass routes, production elsewhere, inventories and lower consumption partly offset that loss. Missing traffic through one waterway is not the net global deficit. Source: IEA Toril Bosoni, 2026-09-18: 중동 공급 부족
-
1
Target
Agreement
-
2
Production
Facilities and storage
-
3
Shipping
Routes, insurance, freight
-
4
Arrival
Timing and landed cost
Bloomberg’s October 4 report still described Saudi, Iraqi and Kuwaiti production as substantially below pre-conflict levels. The quota decision therefore does not demonstrate physical normalization. These sources do not establish an exact October shortage or a defensible oil-price target. Source: Bloomberg / World Oil, 2026-10-04: 생산 목표 동결
For a Korean buyer, the practical questions come after the production announcement: can the cargo load, obtain insurance and arrive on schedule? Alternative origins may preserve volumes but increase freight costs and transit time. Different crude grades also change the product mix a refinery can extract.
Refining and chemicals face different profit tests
Higher crude prices do not automatically enrich refiners. They buy crude and sell products such as gasoline and diesel. The price difference is a refining spread; actual operating profit also reflects freight, energy use, operating expenses and utilization.
A diesel shortage can lift product prices faster than crude and widen spreads. But feedstock scarcity can force lower throughput, reducing sales and raising fixed costs per unit. The IEA reported strong Atlantic Basin margins in August while surging freight weighed on Singapore profitability. Location and procurement routes matter. Source: IEA, 2026-09-11: Oil Market Report
Chemical producers run a different calculation. Naphtha is a refinery-derived feedstock, sourced through imports or domestic refiners, that can be cracked into basic chemicals used in plastics. If final demand is weak, producers may struggle to pass higher naphtha costs to customers. Product-feedstock spreads then narrow.
Refining
Products outpace crude
Upside
Risk · Supply gaps, freight, lower utilization
Petrochemicals
Pass through naphtha costs
Condition
Risk · Weak demand and narrower spreads
The comparison describes mechanisms, not company earnings forecasts. Procurement contracts, product mix and hedges can alter the result. Higher export revenue in refined products, chemicals or plastics may reflect prices rather than greater volumes. More dollar sales alone do not prove higher profit.
Investment incentives can diverge as well. Better-funded firms may diversify feedstock routes or storage. Businesses unable to pass on costs may tie up more cash in inventory and postpone expansion. This is an analytical implication: a prolonged shock can make procurement and financing capacity as important as installed production capacity.
When exchange rates join oil prices, how do living costs change?
Korean-currency crude costs start with the dollar oil price multiplied by the won-dollar exchange rate. If oil rises 10% and the exchange rate rises 5%, the resulting won cost increases 15.5%, because 1.10 times 1.05 equals 1.155. This is an illustration, not a market quote or forecast.
Illustrative won crude cost. All else equal. 1.10×1.05=1.155. Not current prices, retail costs or an inflation forecast. · Axis starts at 93, not zero
That percentage cannot be applied directly to pump prices or consumer inflation. Retail prices also include taxes, distribution costs and inventory timing. Firms may pass on costs, absorb them in margins or reduce production. Households spending more on fuel may cut other purchases.
Electricity involves another layer. Crude quotas do not directly set Korean power tariffs. Regional transport disruptions may affect LNG, and some gas contracts are linked to oil with a lag. Fuel mix, contract terms and tariff decisions determine the timing. Holding tariffs steady can leave costs with the utility instead of removing them.
This extends our earlier discussion of oil costs in the Korean economy upstream into production and shipping. The question of who pays when household costs are delayed also connects with energy support policy design.
Why a supply shock unsettles both rates and equity sentiment
Bosoni’s September 18 argument was conditional: persistent Gulf constraints and falling commercial inventories may require higher prices and further demand reductions to balance the market. Weaker consumption does not ensure cheaper oil when supply is also impaired. An oil rally is not necessarily evidence of a global boom. Source: IEA Toril Bosoni, 2026-09-18: 중동 공급 부족
In an April 14 analysis, IMF chief economist Pierre-Olivier Gourinchas identified anchored inflation expectations as a condition for central banks to look through an energy-price shock. Expectations describe how much people believe prices will rise. This is an earlier analytical framework, not a new response to the October meeting. Source: IMF Pierre-Olivier Gourinchas, 2026-04-14: 전쟁과 정책
Applied to Korea, this framework allows inflation pressure and weaker activity to coexist. Persistent pass-through into wages and services could complicate rate cuts, while weaker spending and investment pull in the opposite direction. These are conditional channels, not predictions of the Fed’s or Bank of Korea’s next decision.
Equity sentiment is mixed. CNN Fear & Greed stood at 43.8, or fear, at 18:00 UTC on October 5: up 9.5 points from 34.4 a week earlier but down 1.4 from 45.2 a month earlier. GoldKimp’s KOSPI measure was 60.5, or greed, on October 1. Dates and methodologies differ; comparable Korean weekly and monthly changes were unavailable. Source: CNN Fear & Greed — 2026-10-05 스냅샷 Source: GoldKimp KOSPI F&G — 2026-10-01
The public SentimentTrader homepage checked on October 6 did not display either Smart Money or Dumb Money Confidence values or their date. No relative positioning conclusion is drawn. Improving US sentiment or a Korean greed reading does not establish stronger oil deliveries. Earnings that reveal higher costs could force prices to adjust. Source: SentimentTrader 공개 홈페이지
What to watch before November 1
First, track loadings and deliveries rather than targets alone. Reopened routes and timely cargoes could ease costs under unchanged quotas. Higher announced production may offer little relief if freight, insurance and delays remain elevated.
Second, watch separate diesel-crude and chemical-naphtha spreads. Third, examine inventories and demand. The IEA’s September outlook projected a 2.5-million-barrel-a-day decline in world oil demand this year. Even if that forecast materializes, delayed supply recovery can prolong cost pressure. Source: IEA, 2026-09-11: Oil Market Report
For company earnings, the practical questions are whether feedstock was secured, what it cost on arrival and how much could be passed to customers. Read the next November 1 decision alongside those three tests to judge what has actually changed for Korean firms and consumers.
Sources and references
- OPEC, 2026-10-04: 7개국 11월 생산 목표
- IEA, 2026-09-11: Oil Market Report
- IEA Toril Bosoni, 2026-09-18: 중동 공급 부족
- Bloomberg / World Oil, 2026-10-04: 생산 목표 동결
- Reuters / Yahoo Finance, 2026-10-04: 회의 전 보도
- The Edge, 2026-10-05: OPEC 국가별 쿼터 전재
- IMF Pierre-Olivier Gourinchas, 2026-04-14: 전쟁과 정책
- CNN Fear & Greed — 2026-10-05 스냅샷
- GoldKimp KOSPI F&G — 2026-10-01
- SentimentTrader 공개 홈페이지
- Profile, 2026-10-04: 국가별 11월 쿼터 교차확인
이 글은 정보 제공 목적이며, 특정 자산의 매수·매도를 권유하지 않습니다.
For information only — this is not a recommendation to buy or sell any asset.
댓글Comments 0