China Manufacturing PMI at 49.3: Why Korean Chip Exports Can Still Rise
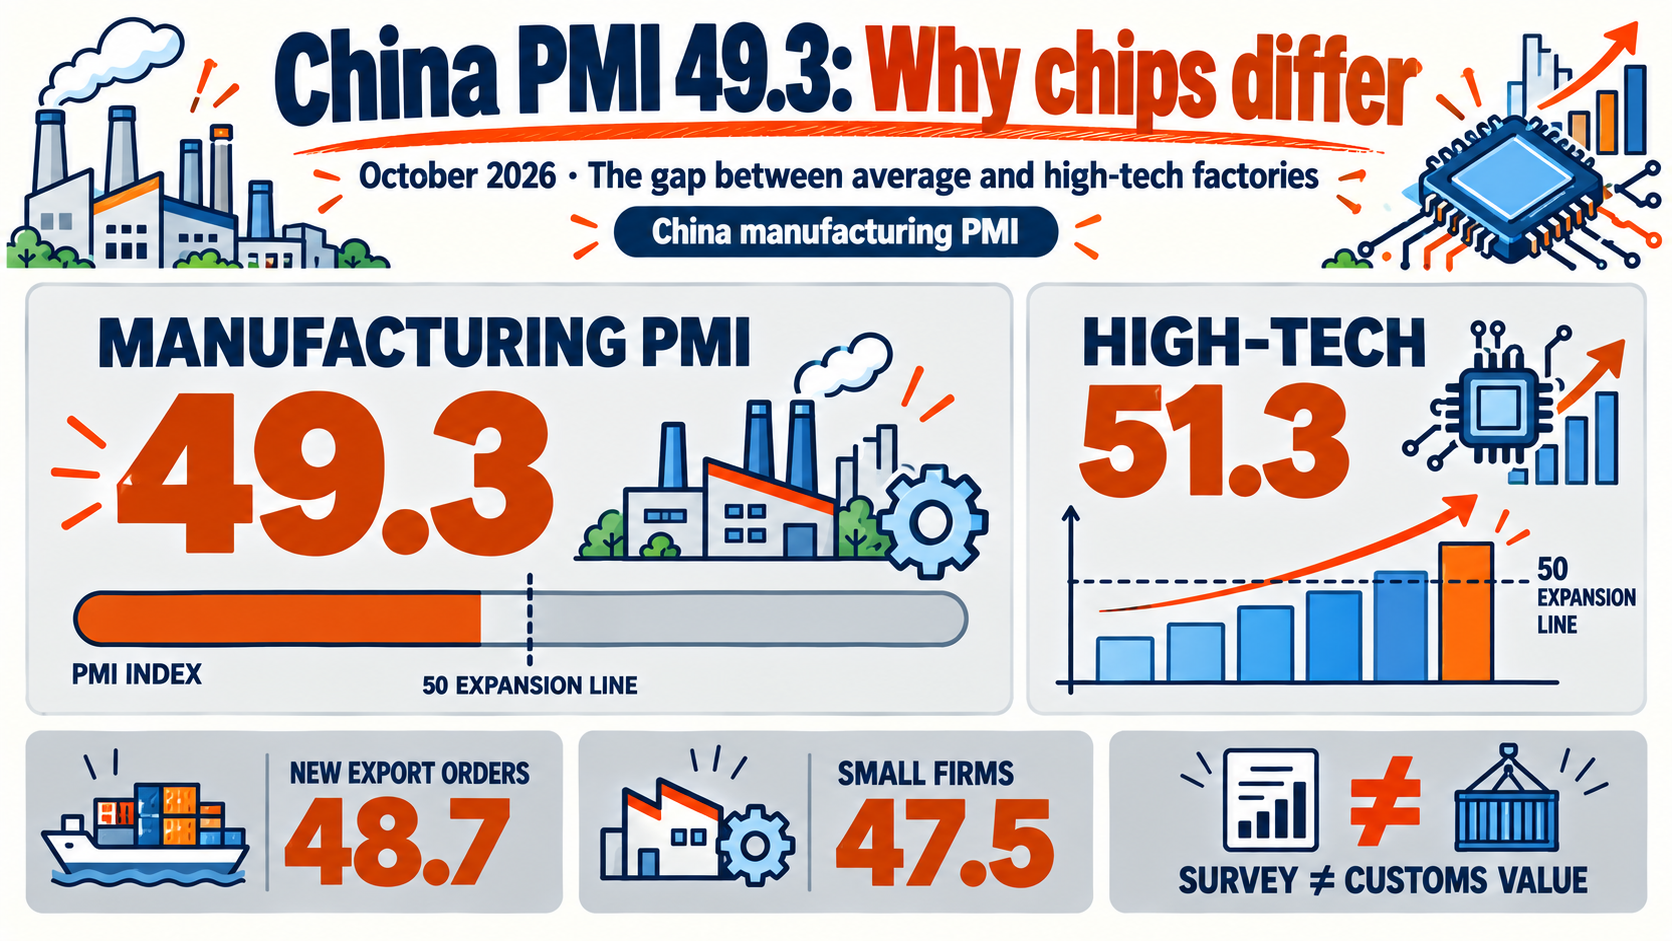
China manufacturing PMI fell to 49.3 in October, while high-tech manufacturing stayed in expansion at 51.3. Strong Korean chip exports can coexist with weaker Chinese factory sentiment: the two measures track different businesses, transactions and time periods. Source: NBS — 2026년 10월 PMI 통계, 10월 31일 Source: NBS 훠리후이 — 10월 PMI 해설, 10월 31일
China is moving at different speeds. A factory buying electronic components and a distributor ordering household goods can face very different demand. Korean companies selling into those markets will not necessarily share the same earnings trajectory.
What does a China manufacturing PMI of 49.3 measure?
PMI surveys purchasing managers about changes from the previous month. Fifty is the expansion threshold; 49.3 does not mean output or revenue fell by 0.7%. The NBS manufacturing survey aggregates responses from a sample of 3,200 enterprises to measure the direction of business conditions. Source: NBS — 2026년 10월 PMI 통계, 10월 31일
The index fell from 50.1 in September to 49.3, so the accurate description is a return to contraction after a one-month rebound: July (49.2) and August (49.8) were also below 50. New export orders slipped from 50.0 to 48.7. That is a signal about incoming overseas business, whereas customs receipts record goods shipped under contracts that may have been signed earlier. Source: NBS — 2026년 10월 PMI 통계, 10월 31일
China export orders
October: 48.7
·
· · Direction versus prior month
· · Orders: China → overseas
Korea exports to China
October: $26.98bn
·
· · +133.6% year on year
· · Customs value: Korea → China
There is another distinction: Chinese export orders concern sales from China to overseas customers. Korean exports to China are goods moving into China. The direction of trade differs before we even consider timing or prices. Opposite signals therefore need not be contradictory.
Why high-tech and smaller factories can diverge
Large enterprises posted a PMI of 50.2, compared with 48.4 for medium-sized and 47.5 for small enterprises. The small-company reading is not a combined SME index. Consumer-goods manufacturing registered 48.8, against 51.3 for high-tech manufacturing. Size and industry classifications overlap and cannot be added together. Source: NBS — 2026년 10월 PMI 통계, 10월 31일 Source: NBS 훠리후이 — 10월 PMI 해설, 10월 31일
Different manufacturing conditions in October. NBS, Oct 31. Above 50: expansion; below 50: contraction. Industry and size categories overlap; these are not growth rates. · Axis starts at 45, not zero
The NBS commentary places both production and new orders in computer, communications and electronic equipment manufacturing at 53 or higher. These are subindices, not a sector-wide headline PMI of 53. They indicate active production chains, rather than proving a broad recovery in household spending. Source: NBS 훠리후이 — 10월 PMI 해설, 10월 31일
One plausible mechanism is that electronics firms with firm contracts keep buying components and investing in equipment, while businesses facing softer final demand delay purchases to avoid excess inventory. Smaller firms may be more exposed if they depend on a few customers or have limited cash buffers. This is an economic interpretation, not a firm-level causal finding established by the survey.
What happens after Korean chips reach China?
Korea’s November 1 trade release puts October exports to China at $26.98 billion, up 133.6% year on year. Its China-bound semiconductor figure of $14.8 billion, up 331%, covers October 1–25 only. Treating it as a full-month result—or dividing it by full-month China exports to calculate a monthly share—would mix reporting windows. Source: 산업통상부 — 2026년 10월 수출입 동향, 11월 1일
A Korean chip can be used in equipment sold inside China or incorporated into a product later exported elsewhere. In the second case, the ultimate buyer is outside China. Factories fulfilling overseas electronics orders can keep purchasing Korean components despite weak Chinese consumption. The releases do not establish the shares following either route.
-
1
Korean components
Orders can precede shipment
-
2
Manufacturing in China
Local use or incorporation into products
-
3
Domestic / overseas sales
Check final buyers and repeat orders
Export value reflects unit prices and product mix as well as shipment volumes. Korea’s trade ministry says global AI investment supported high chip prices and volumes. That does not identify how much of the China-bound increase came from each factor. Higher dollar sales and a broadening of demand across manufacturers are separate claims. Source: 산업통상부 — 2026년 10월 수출입 동향, 11월 1일
Our earlier article on Korea’s October exports and corporate earnings distinguished sales growth from profits. China’s PMI adds another question: which customers are receiving those shipments, and are their next orders still arriving?
What NBS, Korea’s trade ministry and the IMF say: will factory investment reach consumers?
NBS chief statistician Huo Lihui said on October 31 that some demand had been brought forward before the National Day holiday, alongside a complex international environment. Front-loading can weaken the following month’s comparison. But the PMI is seasonally adjusted, so a holiday explanation still needs to be tested against subsequent orders rather than treated as a complete explanation. Source: NBS 훠리후이 — 10월 PMI 해설, 10월 31일 Source: NBS — 2026년 10월 PMI 통계, 10월 31일
Korean Trade Minister Kim Jung-kwan highlighted AI-driven advanced-industry demand on November 1, while warning that smaller and mid-sized companies still faced trade uncertainty. His remarks and China’s size-based PMIs are different kinds of evidence, but both caution against reading aggregate exports as a description of every company’s business conditions. Source: 산업통상부 — 2026년 10월 수출입 동향, 11월 1일
A structural perspective comes from the IMF’s February 18, 2026 analysis. It linked restrained consumption to the property downturn and weak social protection, recommending stronger safety nets and a shift toward consumption-led growth. This is earlier policy analysis, not a new forecast responding to October’s PMI. It helps explain why support for factory capacity and support for household spending may produce different outcomes. Source: IMF — 소비 중심 성장으로의 전환, 2026년 2월 18일
Investment-led support can initially benefit equipment and component suppliers. A wider recovery in consumer orders needs stronger household employment and income prospects. This continues the question in our article on China’s GDP and domestic-demand gap: how far does growth spread through the customer base?
Earnings and share prices respond to different signals
For chip suppliers, customer production plans and the share of higher-priced products matter. Earnings can remain strong while older orders are delivered, even as new orders soften. If customers instead start reducing inventory, component purchases may weaken with a lag. Current customs values are therefore an incomplete guide to next quarter’s earnings.
Materials and consumer-goods companies need pricing power. China’s purchasing-price index of 56.8 and factory-gate price index of 51.7 measure the direction of reported price changes. Their 5.1-point gap is not a profit-margin decline. Actual margins depend on cost increases, selling prices, inventory and contract terms. Source: NBS 훠리후이 — 10월 PMI 해설, 10월 31일
Persistent profit pressure can delay hiring or capacity expansion; weaker income expectations can then hold back household spending. A broader recovery in orders could improve that chain. One month’s survey does not determine which path will prevail.
Prices also respond to expectations. In the supplied snapshot, CNN Fear & Greed was 25.3, or Fear, on November 2—down 4.5 points from a week earlier and 12.9 from a month earlier. GoldKimp’s KOSPI measure was 76.7, or Extreme Greed, on October 30. Comparable Korean historical readings were unavailable, and different methods prevent a direct numerical comparison of the two indices. Source: CNN — Fear & Greed, 2026년 11월 2일 스냅샷 Source: GoldKimp — KOSPI Fear & Greed, 2026년 10월 30일
With US risk appetite weakening and the Korean gauge still optimistic, it is worth testing expectations that electronics strength will lift all exporters. This does not establish that China’s PMI caused the sentiment divergence. SentimenTrader’s public page was also checked on November 3, but both Smart Money and Dumb Money values and their dates were blank; they cannot substantiate a claim about investor positioning. Source: SentimenTrader — Smart/Dumb Money 공개 페이지
What to watch next: export orders, breadth and customer inventory
In the next Chinese PMI, watch both export orders and demand beyond high-tech manufacturing. Compare Korean China-bound export values and volumes over matching periods, then check company disclosures for customer inventory and future purchasing plans. Electronics-only strength has different implications for Korea from a recovery that reaches consumer goods and smaller businesses.
The evidence establishes coexistence: weaker average manufacturing conditions and expanding high-tech production chains. For a Korean supplier, ask who buys its components and where the finished product is sold. Those answers say more about sales durability and earnings than a single verdict on “the Chinese economy.” This article provides economic analysis, not a recommendation to buy or sell an asset.
Sources and references
- NBS — 2026년 10월 PMI 통계, 10월 31일
- NBS 훠리후이 — 10월 PMI 해설, 10월 31일
- 신화통신 — 제조업 둔화와 첨단산업 확장, 10월 31일
- 산업통상부 — 2026년 10월 수출입 동향, 11월 1일
- IMF — 소비 중심 성장으로의 전환, 2026년 2월 18일
- Reuters/Fidelity — 중국 제조업 위축, 2026년 10월 31일
- CNN — Fear & Greed, 2026년 11월 2일 스냅샷
- GoldKimp — KOSPI Fear & Greed, 2026년 10월 30일
- SentimenTrader — Smart/Dumb Money 공개 페이지
For information only — this is not a recommendation to buy or sell any asset.
Comments 0