China GDP rebounds 4.5% as property investment falls 20.6%: why stimulus design matters for Korea
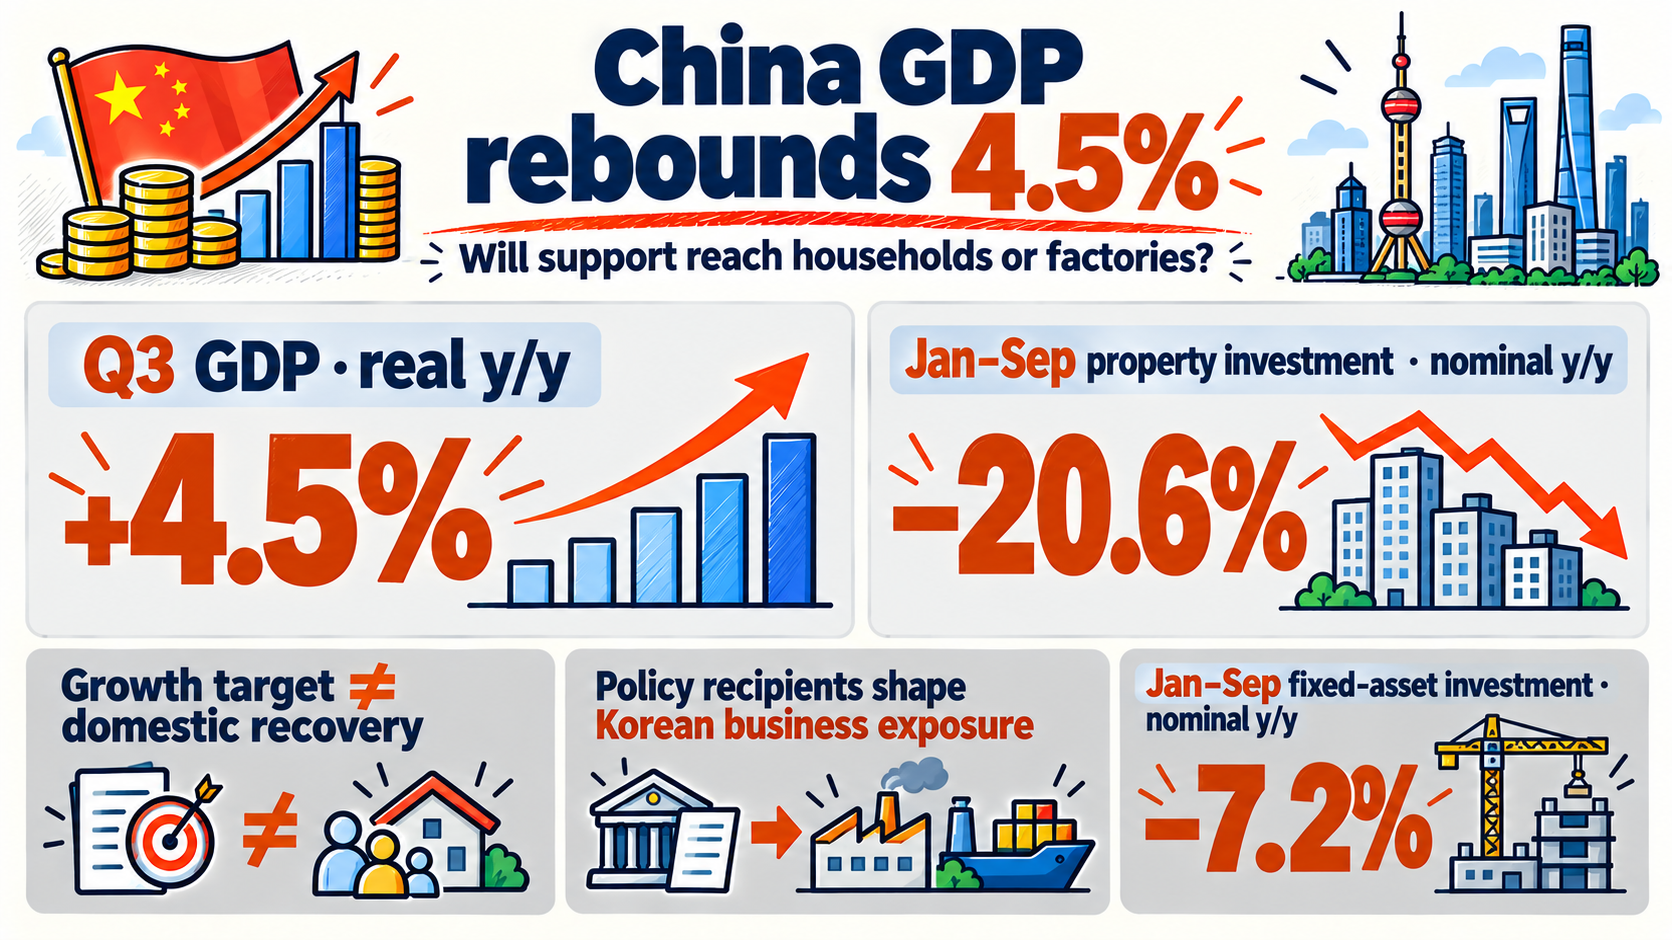
China GDP grew 4.5% year on year in the third quarter of 2026, while property development investment fell 20.6% over January–September. For Korean businesses, the next question is where support goes: toward household purchasing power or additional industrial capacity. That choice can change both orders and competitive pressure. Source: NBS 업종별 GDP 잠정치 · 2026-10-21 Source: NBS 1~9월 경제동향 · 2026-10-19
This article centers on the sector accounts released in Chinese on October 20 and in English on October 21. The initial economic release was October 19. Growth beat the 4.4% Reuters poll forecast, but beating expectations does not establish a domestic-demand recovery. Source: NBS 업종별 GDP 잠정치 · 2026-10-21 Source: Reuters GDP 분석 · 2026-10-19
China GDP rebounds, but factories and construction diverge
Manufacturing value added rose 5.9%, construction contracted 4.4%, and information transmission, software and IT services grew 9.8%. Value added measures output less intermediate inputs. Digital activity expanded while construction shrank. Source: NBS 업종별 GDP 잠정치 · 2026-10-21
These are third-quarter real growth rates, not percentage-point contributions to GDP. Sectors have different weights. The table also does not identify the precise share of growth attributable to AI or exports.
Manufacturing
+5.9%
Real value added
Construction
−4.4%
Real value added
Information / software / IT
+9.8%
Real value added
Our earlier September export analysis examined goods crossing the border. Here the focus is the gap between production and spending inside China. A factory with overseas orders can be busy while a housing supplier cuts spending. One national growth rate cannot describe both businesses.
Why can production rise while new investment falls?
Fixed-asset investment, which covers spending on assets such as buildings and equipment and excludes rural households, fell 7.2% over January–September. Excluding property development, it fell 4.2%; manufacturing investment fell 2.1%. The investment weakness extended beyond housing. Source: NBS 1~9월 경제동향 · 2026-10-19
Decline in investment spending. NBS: actual changes are −7.2%, −4.2%, −2.1%, −20.6% y/y. Bars show absolute decline magnitudes. Total excludes rural households.
Investment figures measure cumulative nominal spending; the sector growth figures measure quarterly real value added. Their periods and price treatment differ. Fixed-asset investment also differs in scope from national-accounts investment. Subtracting the two does not reveal a GDP shortfall.
Production and new investment can also diverge economically. Running an existing plant longer raises output without building another plant. When demand durability is uncertain, a firm may use existing capacity and delay expansion. The aggregate data do not prove that any particular company did so; this is the mechanism that makes the combination possible.
Cash flow matters in housing. If presale receipts weaken, developers may prioritize unfinished projects and debt repayment over new projects. Materials orders and related jobs can suffer, encouraging households to postpone major purchases. This extends our earlier housing and consumption discussion to corporate investment decisions.
Growth is near target, so why isn’t the stimulus debate over?
In the October 19 Reuters report, ITC Markets Asian FX and rates analyst Andy Ji argued that stronger activity reduced the urgency of immediate broad easing. A more attainable 4.5%–5% annual target could give policymakers room to assess the timing and size of further support. This is an analyst interpretation, not a PBOC decision to stop easing. Source: Reuters GDP 분석 · 2026-10-19
The official diagnosis is not unreservedly optimistic. The NBS flagged insufficient domestic demand on October 19. The IMF’s February 2026 Article IV report described property-related spillovers to local finances and demand. Read together, the latest quarter and the earlier structural assessment suggest that achieving a target and repairing household conditions remain different tasks. Source: NBS 1~9월 경제동향 · 2026-10-19 Source: IMF 중국 Article IV · 2026-02-18
On December 10, 2025, IMF Managing Director Kristalina Georgieva warned that continued export-led growth at China’s scale could intensify trade tensions. This was not a response to the new GDP release. Its relevance is the question of who ultimately buys additional output. If domestic spending does not keep pace, firms may seek more buyers abroad and intensify competition. Source: IMF 게오르기에바 발언 · 2025-12-10
The next policy question goes beyond the size of a rate cut. Support that reduces household income insecurity may lift consumption orders. Support for equipment investment can first change Chinese producers’ costs and capacity. The same broad category of fiscal spending can therefore produce different outcomes for Korean suppliers. The diagram describes conditional mechanisms, not an announced policy schedule.
Household support
May reduce income insecurity
First effect
Korean exposure · Benefits require spending to become import orders
Capacity support
May change costs and capacity
First effect
Korean exposure · Equipment opportunities and product competition may coexist
Why a stronger yuan does not guarantee Korean earnings
Yuan strength was visible before the GDP release. Reuters reported an onshore rate of 6.6907 yuan per dollar in late-morning trading on October 16, with the currency heading for a third consecutive weekly gain. That move cannot be attributed to the October 19 GDP announcement, and the quote is not a current exchange rate. Source: Reuters 위안화·정책 발언 · 2026-10-16
Exporters converting dollar receipts can create demand for yuan. Reduced expectations of rate cuts can also support a currency, other things equal. Capital flows, broader dollar moves and currency management intervene, however. A goods trade surplus alone does not determine the next exchange-rate move.
For Korean firms, the useful condition is more specific: the yuan must strengthen relative to the won, and Chinese rivals must pass costs through to overseas buyers. Rivals may instead absorb a margin reduction or benefit from cheaper imported inputs. Relative currency moves, invoice currencies and hedging matter more than the yuan-dollar quote alone.
Korean chips and autos: identify the source of the next order
For semiconductors, higher Chinese factory output does not automatically become orders for Korean suppliers. Greater use of existing lines may raise component demand, while delayed new investment can restrain incremental equipment and materials orders. Chip types, customer exposure, inventories and purchasing contracts matter. Manufacturing GDP does not disclose those relationships.
Korean memory margins depend on product mix, contract prices and costs as well as Chinese activity. Weak household demand could disappoint smartphone and appliance demand while sustained AI server investment supports advanced memory separately. This is a conditional analysis, not an earnings-growth forecast derived from GDP.
Autos require a joint view of household purchasing power and rival sales strategies. Household support may expand the market, but gains concentrated in local brands need not benefit Korean manufacturers. If capacity support comes first and domestic sales lag, overseas discounting and promotion may intensify.
Semiconductors
Higher utilization leads to Korean component orders
Opportunity
Constraint · Delayed expansion, inventories, product-specific demand
Autos
Household recovery translates into Korean-brand sales
Opportunity
Constraint · Local-brand concentration and overseas promotion
Materials producers need the same distinction. Weak construction demand can limit recovery in commodity-grade materials even as GDP rebounds. A broader recovery in consumption and viable construction projects could widen the order recovery. Commodity prices also respond to demand elsewhere and supply disruptions, so China’s GDP is not a sufficient price forecast.
For markets, watch earnings revisions after the growth headline
Sentiment is split between the two markets. CNN’s US Fear & Greed Index stood at 20.0, extreme fear, on October 22. It was down 10.3 points from 30.3 a week earlier and 15.0 points from 35.0 a month earlier. GoldKimp’s KOSPI measure was 70.8, greed, on October 21. Korean week/month comparisons were unavailable, and the two differently constructed indices are not interchangeable trading signals. Source: CNN Fear & Greed · 제공 스냅샷 2026-10-22 Source: GoldKimp KOSPI F&G · 제공 스냅샷 2026-10-21
US CNN
20.0 · Extreme fear
Oct 22
Week / month · −10.3pt / −15.0pt
Korea GoldKimp
70.8 · Greed
Oct 21
Week / month · Comparisons unavailable
SentimenTrader’s Smart Money and Dumb Money readings were left out because no dated public values could be confirmed. No conclusion about opposing institutional and retail positioning is drawn. With US caution and stronger Korean expectations coexisting, the key test is whether China’s growth rebound produces actual upward revisions to Korean earnings estimates. Source: SentimenTrader · 공개 수치 미표시
Future releases should be read beyond headline growth: does investment excluding property improve, does household support become purchases and orders, and do Korean suppliers report stronger orders alongside better earnings expectations? If prices move first on policy hopes, delays in earnings confirmation can increase volatility.
The significance of this China GDP release lies partly in the investment and consumption questions the rebound leaves unresolved. Korean business opportunities become clearer by tracing who receives support and what they buy. This article explains economic mechanisms and does not recommend buying or selling any asset.
Sources and references
For information only — this is not a recommendation to buy or sell any asset.
Comments 0