KOSPI 6000s Money Map — After Black Monday 6800, Where Did the Cash Go?
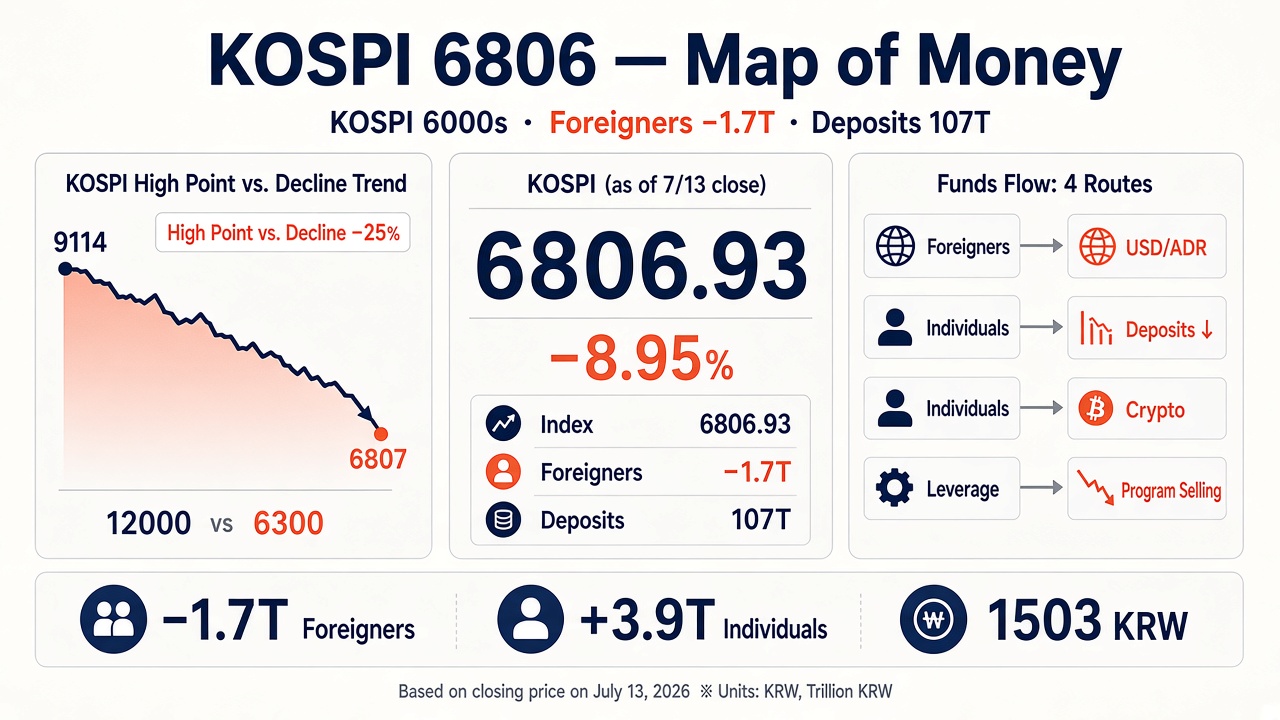
On July 13, 2026, the KOSPI 6000s became real. Closing print: 6806.93 (−669.01 points, −8.95%). From the June 22 close high of 9114.55, roughly 25% was cut in about 17 sessions, and the 7000 handle — closed — broke for the first time in about two months since early May.
Intraday, a sell-side sidecar and a circuit breaker both tripped. A sidecar briefly pauses program (basket) orders when they overheat versus index/futures rules. A circuit breaker cools the whole market for ~20 minutes after a large one-day index drop. On the day: sell sidecar at 10:34, circuit breaker at 13:28 — the seventh CB of the year.
A plunge recap alone is not enough. Most readers ask two things: where did the money go, and where does KOSPI go next. This piece maps both with the same day’s numbers. Not investment advice.
That day’s flows — foreigners & institutions sold, retail bought
On the main board (Newspim and peers): foreigners net-sold about ₩1.7T, institutions about ₩2.2T, individuals net-bought about ₩3.9T — the classic “retail alone” headline. SK hynix (~−15.4%) and Samsung Electronics (~−10.7%) drove the index given their weight.
The bar below only shows who bought and sold. Where cash went is the next map.
KOSPI Black Monday net buy sell by investor type. KRX main-board net (+buy / −sell). Newspim et al. (−1.7062 / −2.2092 / +3.8934 ₩T). Minor media variance possible. Not advice.
Why it fell — four catalysts in one session
Call it “semis weak” and you miss the stack. Coverage clusters around four triggers.
First, SK hynix ADR. An ADR is a US-listed certificate that lets you trade the same company in dollars. After the July 10 Nasdaq debut (day-one ~+13% vs offer), the home listing read as sell-the-news plus foreign selling of the Korean line and a liquidity tilt toward the ADR.
Second, peak-out fear. Memory-cycle-top narratives survived the ADR splash; some below-consensus earnings views amplified selling. Early-July chip exports still looked strong in places — so “real peak confirmed” and “price/flow overreaction” are still competing.
Third, single-stock leverage ETFs. ETFs are funds that trade like stocks. Leverage ETFs chase a multiple of daily moves, so in a drop they often mechanically sell more underlying (short-gamma). Peer AUM that once near ₩16T fell under ₩10T, with many fresh lows (Yonhap). Pushback exists that the rebalance share of turnover is overstated — treat them as an amplifier, not a sole culprit.
Fourth, US–Iran Hormuz tension. Weekend strike news and WTI +~4% hit a oil-importing equity market and the won together. See also our Middle East / oil piece.
Where the money went — destination map
“Cash left equities = one destination” is usually wrong. Session lens: who sold, how investor deposits shrank, and whether alternate assets spun harder. Traceable one-line wiring statistics barely exist.
Foreigners → dollars, FX, (partly) ADR. ~₩1.7T of net selling can feed KRW sell / USD demand. Spot/week USD/KRW printed 1503.4 — ADR dollar inflows were still largely expected, not fully remitted, so 1500 stuck. “Korea exit” and “channel shift into the same firm’s ADR” are mixed. Ties to our KRW 1500 H2 outlook.
Retail → dip-buy + cash-out + (partial) crypto / US stocks. Client deposits are brokerage cash waiting to buy stocks. From ~₩132.5T (Jun 29) to ~₩107.1T (Jul 9) — eight straight down days, roughly a five-month low. With ~₩3.9T of retail buying on the crash day, a large slice of the deposit drop is simply cash that already became shares. “Ammo empty / account withdrawals” narratives coexist. Dip-buying and cashing out happened together.
Crypto: Upbit 24h volume ~$4.12B (+436%) (Coingecko via secondary reports) into the plunge — a stock–crypto rotation spike. Net transfer size from equities is not published. Volume ≠ net flow. US-listed buying on Korean crash days has also been reported before — fatigue rotors toward dollar assets.
Institutions / pensions. ~₩2.2T net institutional selling. Hana and peers stress repricing / NPS rebalancing more than an earnings cliff. “Relative safety” shifts into banks appear around the selloff, but a clean same-day bank-transfer print is thin.
Leverage ETF feedback. Drop → rebalance sell → more drop → margin/redemptions. NAV collapse both removes exposure and forces mechanical selling. Samsung + hynix credit balances ~₩10.6T, unsettled trades ~₩1.4T (as of the 10th) — forced selling risk. Pair with our semiconductor selloff / bottleneck outlook.
Classic bond/gold haven flows are weakly evidenced as the day’s core story. Risk and “safe” assets wobbling together shows up in other coverage. The main narrative looks like the flow chart below.
-
1
① Peak ~9000s
Jun 22 close 9114 → Jul 13 6807 (−25%)
-
2
② Foreign selling
~₩1.7T → USD·FX / (part) ADR
-
3
③ Institutions
~₩2.2T · rebalance / risk-off
-
4
④ Retail deposits
132→107T · buy + cash-out
-
5
⑤ Crypto / US / lev.
Upbit +436% · short-gamma amp
By the numbers — peak→6800, deposits −₩25T
Put the index path beside deposit shrinkage and you see both price damage and cash ammunition drawn down — before PER talk.
KOSPI path 9114 to 6806 and deposits 132T to 107T. KOSPI: Jun 22 close high 9114.55 → Jul 13 close 6806.93 (~−25%). Separate scale from deposits chart below. Not advice.
KOSPI path 9114 to 6806 and deposits 132T to 107T. Investor deposits: Jun 29 132.47T → Jul 9 107.13T (press citing KOFIA; ~−₩25T). Not advice. · Axis starts at 95, not zero
After the KOSPI 6000s — 12000 or 6300?
Same-day Street numbers, listed as scenario tick marks, not answers.
Goldman Sachs keeps a 12-month KOSPI target at 12000, citing 12m fwd PER ~6.2× (lowest zone since 2004) as an opportunity frame. PER is roughly “price versus next year’s earnings.” Cheap multiples fail if earnings fade.
LS Securities (Jeong) flags hyperscaler capex as the key variable and a low candidate near 6300. Hana (Kim) calls it closer to repricing than a new bear — watch ADR premium, memory prices/estimates, and client deposits. Shinhan had floated a W-box (~7550–7650 low / 8300–8400 high), leverage cutbacks, then a 7350–7400 retest and big-tech capex checks. The Jul 13 close at 6806 sits below that box floor — either undershoot or a band that needs rewriting. Reader’s call.
Goldman · 12000
Oversold / buy-opportunity
Stance
Number · 12m tgt 12000 · fwd PER ~6.2
Condition · Valuation floor zone
LS · 6300
Limited undershoot room
Stance
Number · Low candidate ~6300
Condition · Hyperscaler CAPEX key
Hana · Repricing
Not fresh bear start
Stance
Watch · ADR premium·memory·deposits
Read · Flow-driven reprice
Shinhan · W-box
~7550–8400 (cited)
Band
Note · Cut leverage
Now · 6806 below box floor
Research sketch only: Base = ADR/memory hold, Hormuz eases, reclaim box/repricing; Bull = ASML/TSMC + hyperscaler capex kills peak-out talk; Bear = oil spike + margin flush + further deposit drain into the LS-style 6300s. Probabilities are subjective — the calendar is more useful.
Catalyst calendar — ASML → TSMC → Big Tech capex
Checklist from domestic coverage: Jul 15 ASML (lithography / AI spend stamina), Jul 16 TSMC (foundry guidance), late July Alphabet/Microsoft (~28), Meta/Amazon (~29–30) earnings and capex. How much hyperscalers still spend on AI is the memory peak-out debate’s real answer. Parallel: US CPI/PPI (rates/dollar → KRW/foreign flow); medium term: ADR cash remittance (whether 1500 sticks). Sidecar-heavy tape also pairs with our sidecar zero-day note.
- Jul 15 ASML — AI equipment spend stamina
- Jul 16 TSMC — foundry / guidance
- Late July MSFT·GOOG·META·AMZN — CAPEX as memory-demand pivot
- Parallel: US inflation → dollar/foreigners / ADR remittance → USD/KRW
Wrap-up
The KOSPI 6000s are both a fear session and a day when capital reallocated across several pipes. Foreign selling mixes USD/FX pressure with ADR channel shift; retail deposit decline mixes dip-buying and cash-out. Upbit’s volume spike is rotation, not proven net transfer. Leverage ETFs amplified the drop even if they weren’t the sole cause.
Forward path sits between Goldman 12000 and LS 6300, with Hana’s repricing frame tensed against Shinhan’s pre-plunge box. What you can calendar is ASML → TSMC → big-tech CAPEX. Don’t invent a single destination for the money — track who sold and what still needs confirming. Research commentary only; not trading or investment advice.
Don’t invent one destination for the cash — track who sold, and what still needs confirming.
Sources
- Newspim — KOSPI 6806.93 close & flows
- Korea Times — Black Monday below 7000
- MoneyToday — Goldman 12000 / fwd PER
- Pressian — investor deposits 107T
- Sisa Journal — four catalysts & CAPEX calendar
- MoneyToday — LS 6300 low candidate
- Asia Economy — Hana repricing
- Seoul Economic Daily — USD/KRW 1500
- HTX / Coingecko — Upbit volume +436%
- Maeil Business — credit/margin 10.6T
- Yonhap — single-stock leverage ETF lows
For information only — this is not a recommendation to buy or sell any asset.
Comments 0