China Exports Jump 36.3%: Why Chips and Cars Mean Different Things for Korea
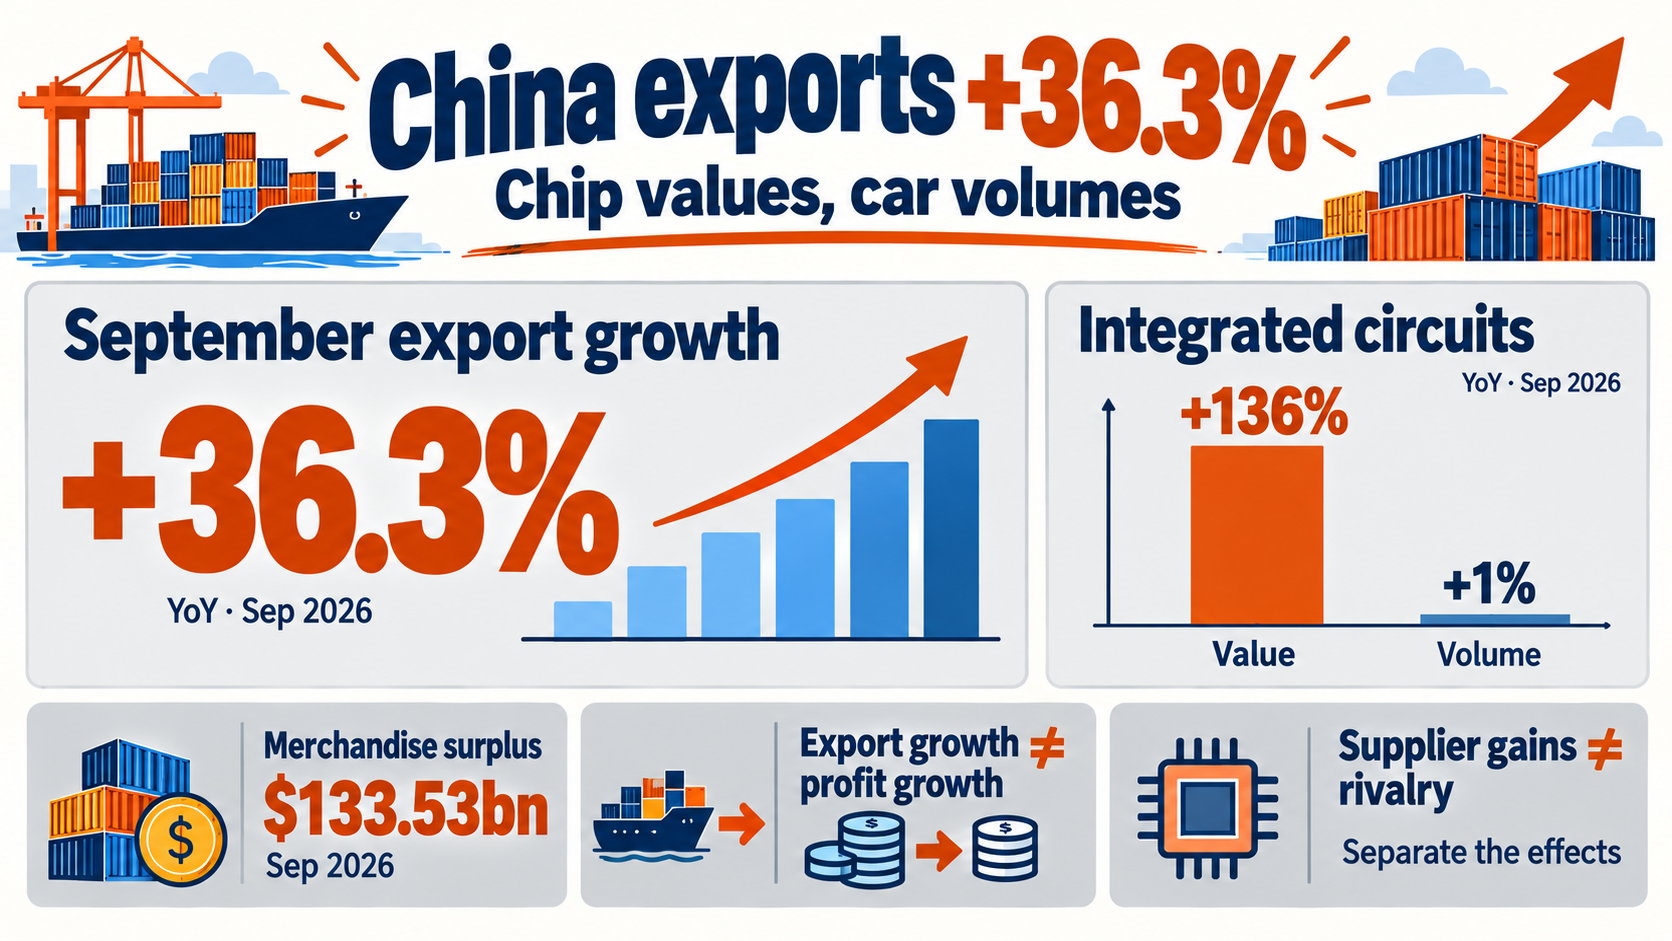
China exports rose 36.3% year over year in September 2026, Reuters reported on October 14, citing customs data. For Korean companies, the key question is what China shipped in greater quantities and what generated more revenue per unit. Chips and cars give different answers. Source: REUTERS
Goods shipped from China are not all competitors to Korean products. They may contain Korean components or come from a Korean-owned factory in China. Others compete for the same overseas buyer. Customs origin and corporate nationality are different concepts.
Why the surplus reached $133.5 billion even as imports rose 31%
Reported September exports were $447.18 billion and imports were $313.65 billion, producing a merchandise surplus of $133.53 billion. Imports also increased 31% year over year. This was not a surplus created by falling imports: the larger export base grew faster. Source: AUTO
September China merchandise trade. USD billions, September 2026. Anadolu citing customs; surplus = exports minus imports.
AP put the January–September surplus at $938.1 billion. That leaves $61.9 billion to reach $1 trillion, a subtraction rather than a forecast. The next month’s outcome and a full-year record remain uncertain. Merchandise trade is also narrower than the current account, which includes services and income. Source: AP
Import growth does not automatically establish a consumer recovery. Imports include production inputs, energy and raw materials. More inputs for export orders, or higher input prices, can raise the import bill without a comparable improvement in household purchasing power. Product and volume data are needed to distinguish these channels.
Chips show a value surge; cars also show a volume surge
SCMP’s October 14 report, citing customs figures, put integrated-circuit exports at about $45 billion and 32.7 billion units. Value rose 136% but volume only 1%. The revenue surge cannot be treated as equivalent growth in chip output or advanced-technology market share. Source: CHIP
Chips: value versus volume. Year-over-year %, September 2026 IC exports. SCMP citing customs; not a matched-product price index.
Dividing value growth by volume growth implies an approximately 133.7% increase in average declared value per unit: 2.36 divided by 1.01, minus one. That average combines price changes with shifts toward more expensive products. It does not show that the price of an identical chip rose 133.7%.
AI investment helps explain the divergence. Data centers need memory as well as processors. Orders concentrated in products whose supply cannot expand quickly can lift prices. SCMP linked the increase to memory shortages associated with AI infrastructure investment. The product figures used here come from reporting of customs data; the underlying customs table was not independently downloaded. Source: CHIP
Cars look different. Anadolu reported exports of 1.18 million vehicles, with volume up 56.3% and value up 62%. The same calculation implies a roughly 3.6% rise in average declared value per vehicle. Model mix still matters, but the role of actual shipment growth is much clearer than for chips. Source: AUTO
Cars: substantial volume growth. Year-over-year %, September 2026. Anadolu citing customs; not model-level margins. · Axis starts at 53, not zero
Korean earnings depend on whether a company supplies or competes
The following is an impact analysis, not a reported earnings result. Korean memory producers could benefit from the same global demand supporting prices. If Chinese assemblers buy more Korean components for export orders, volumes could benefit too. But Chinese chip export revenue does not prove higher orders for Samsung Electronics or SK hynix; customer purchases, product prices and inventories matter.
Autos face a more direct contest for overseas buyers. If Chinese manufacturers use discounts or subsidized financing to support volume, Korean rivals may have to respond. Unit sales can rise while margins fall if incentives and financing support increase faster. For Hyundai and Kia, regional pricing, incentives and local production matter alongside units sold. This is a transmission mechanism, not a claim that either company has announced lower profits.
Supplier to Chinese exports
Potential input orders
Orders
Profit condition · Pricing and cost control
Competitor overseas
Potential incentive pressure
Selling terms
Profit condition · Differentiation and local margins
Intermediate goods are inputs used to make finished products. Suppliers to Chinese export factories may gain from higher utilization. Companies selling materials that Chinese producers also export may instead face tighter pricing. Customer exposure and product specifications can produce different outcomes even within the same materials industry.
Consumers may gain when cheaper imports or components reduce purchase costs. But margin pressure can also lead firms to restrain hiring, wages or capital spending, weakening consumption through another channel. Gains for one supply-chain participant are not the same as the net effect on the whole economy.
AI demand pushes, energy costs press: what GAC and the IMF said
At the October 14 briefing, GAC deputy head Wang Jun described first-three-quarter trade growth as the fastest for the same period in five years. SCIO reported total trade of 39.94 trillion yuan, up 18.8%. That is a cumulative yuan-denominated sum of exports and imports, not a figure directly comparable to September’s dollar export growth. Source: GAC
On the same day, IMF Managing Director Kristalina Georgieva described opposing forces: a positive AI demand shock and a negative energy supply shock from the Middle East war. Economies integrated into AI supply chains were doing relatively better. This fits the distinction here: strong orders need not translate fully into profits when energy, transport and materials become more expensive. Source: IMF
In its China consultation published on February 18, the IMF Executive Board prioritized a shift toward consumption-led growth. This is an earlier structural recommendation, not a new October forecast. Busy export factories alone do not establish stronger household spending power, a connection explored in our China housing and consumption article. Source: IV
The market backdrop also matters. The supplied October 14 CNN Fear & Greed snapshot was 32.0, in fear: down 10.2 points from a week earlier but up 1.0 from a month earlier. GoldKimp’s October 13 KOSPI component mean was 65.2, in greed. Methodologies differ, so the gap is not a measure of capital flows. Comparable Korean weekly and monthly observations were not available. Source: CNN Source: KR
SentimenTrader’s public Smart Money and Dumb Money fields and update date were blank when checked. They therefore provide no usable evidence here of a current divergence between those groups. With US caution and Korean optimism coexisting, Chinese export strength should prompt scrutiny of earnings expectations already in prices rather than a blanket buy signal for Korean exporters. Source: SMART
A bigger surplus brings trade pressure and local-production costs
Reuters reported September surpluses of $34.01 billion with the United States and $34.8 billion with the EU. Bigger surpluses do not automatically cause tariffs or currency appreciation. They can, however, increase political pressure from import-competing industries. This analysis does not assume a particular new restriction or implementation date. Source: REUTERS
That need not be a simple windfall for Korean firms. Restricted Chinese shipments could move to other markets and intensify competition there. Local production may improve market access, but new plants require upfront cash and can start with low utilization. Capacity may expand without an equivalent increase in final demand.
Currency effects are conditional too. Converting export dollars into yuan creates demand for the currency, but dollar retention, overseas investment, capital outflows and interest differentials can offset it. A large surplus alone does not predict yuan or won appreciation. Korean firms must consider the balance between dollar revenue and dollar costs as well as competitive selling prices.
What to check in the next earnings reports
For chips, compare like-for-like contract prices, shipments and inventory. For cars, net selling prices after incentives and regional profitability may reveal more than overseas unit sales alone. For intermediate goods, check actual orders from Chinese customers and the ability to pass through input costs. Improvements in these measures would support the link from trade news to earnings.
As in our analysis of Korea’s September export divergence, a national export growth rate adds together different company experiences. China’s chip values and vehicle volumes tell distinct stories. That distinction helps locate both the opportunity and the pressure for Korean firms. This article analyzes economic mechanisms and is not a recommendation to buy or sell an asset.
Sources and references
- Reuters, 2026-10-14: China September exports and surplus
- AP, 2026-10-14: China trade surplus
- SCIO / GAC, 2026-10-14: First-three-quarter trade briefing
- SCMP, 2026-10-14: IC export value and volume
- Anadolu, 2026-10-14: Trade and vehicle export figures
- IMF, 2026-10-14: Kristalina Georgieva global policy briefing
- IMF, 2026-02-18: China Article IV consultation
- CNN Fear & Greed, supplied snapshot 2026-10-14
- GoldKimp KOSPI Fear & Greed, supplied row 2026-10-13
- SentimenTrader: public index fields unavailable at access
For information only — this is not a recommendation to buy or sell any asset.
Comments 0