Microsoft and Alphabet earnings: $18.6bn vs -$9.1bn in free cash flow
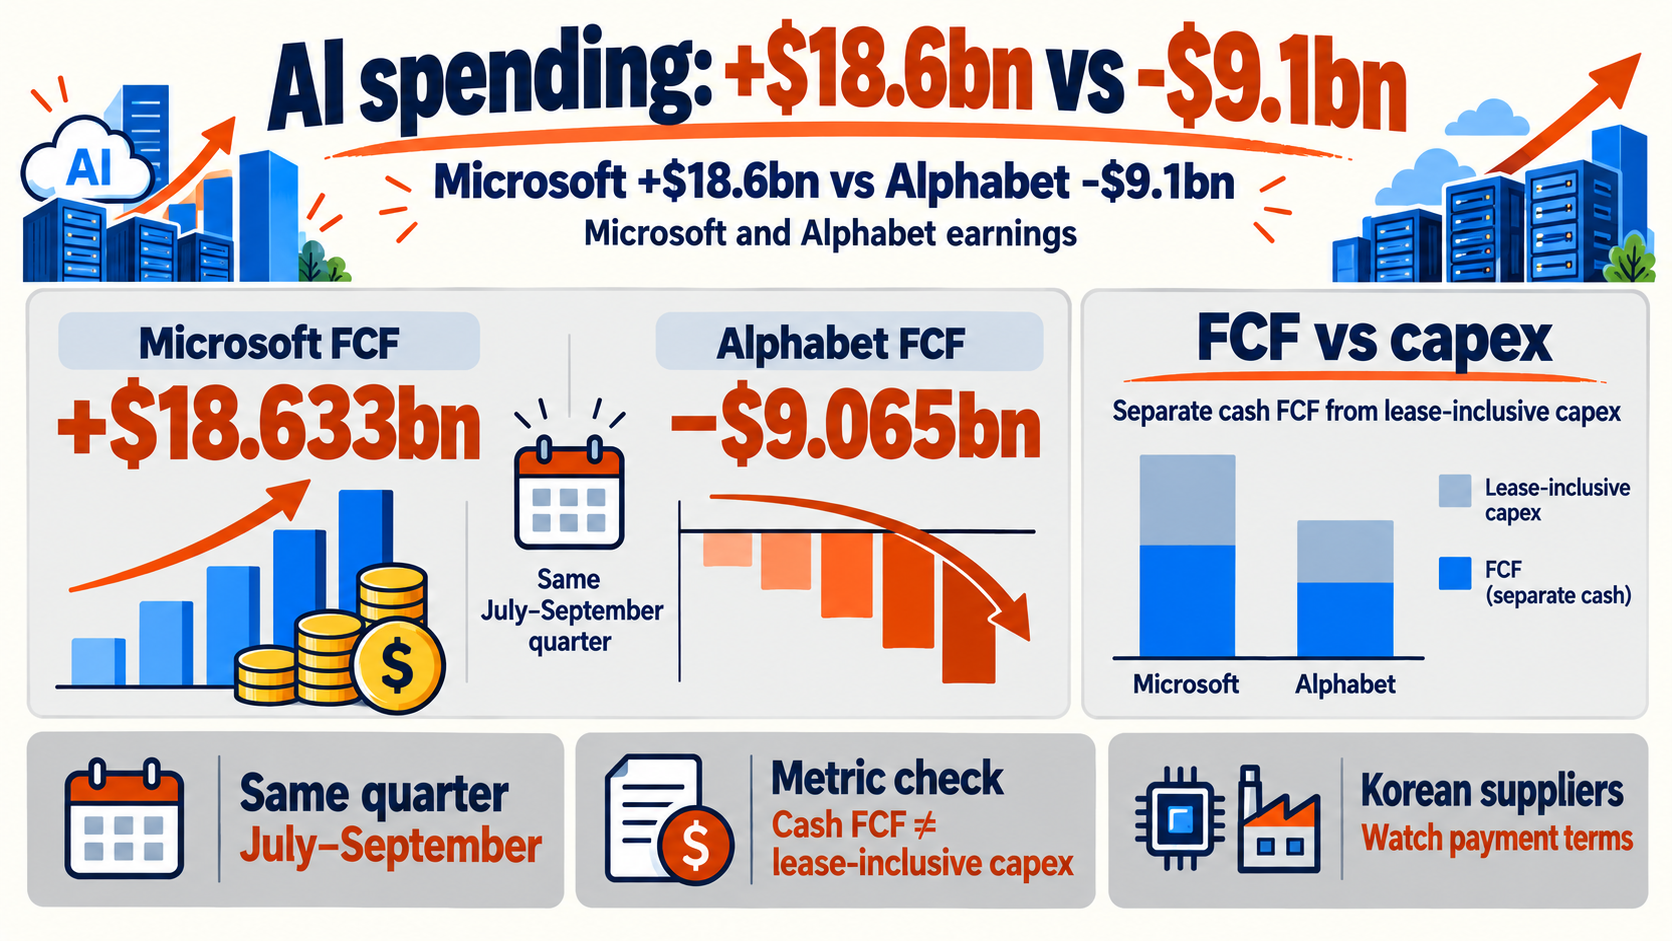
Microsoft and Alphabet earnings reveal a gap in cash left after investment. For July–September 2026, free cash flow was $18.633 billion at Microsoft and negative $9.065 billion at Alphabet. For Korean chip, power-equipment and machinery suppliers, the question is how long customers can sustain their orders. Source: Microsoft SEC Source: Alphabet SEC
Both companies reported on October 28 in the United States. Microsoft’s fiscal Q1 2027 and Alphabet’s calendar Q3 2026 cover the same period. Reported results, management guidance and our interpretation of Korean industry effects are distinguished below.
Microsoft and Alphabet earnings: start with cash spending
Free cash flow, or FCF, subtracts cash spent on property and equipment from operating cash flow. We use that basis for both companies. A profitable business can leave little cash behind in a quarter when it pays for servers and data centers.
Microsoft generated $58 billion in operating cash and paid $39.367 billion for property and equipment. The difference is $18.633 billion. Reported capex of $45.2 billion includes finance leases. Acquiring an asset and paying cash for it can occur at different times, so subtracting that broader figure would not reproduce this FCF measure. Source: Microsoft 현금흐름표 Source: 리스 포함 CapEx 보도
Alphabet generated $42.290 billion in operating cash and spent $51.355 billion on property and equipment, leaving a $9.065 billion gap. Its operations still generated cash; investment spending exceeded that amount. Source: Alphabet FCF 조정표
Microsoft
$58.000bn
Operating cash
Cash PPE · $39.367bn
FCF · +$18.633bn
Alphabet
$42.290bn
Operating cash
Cash PPE · $51.355bn
FCF · −$9.065bn
Microsoft’s comparable prior-year FCF was $25.663 billion. Operating cash increased, but equipment spending rose faster, reducing FCF by about 27.4%. Positive FCF and a shrinking cash cushion can coexist. Source: Microsoft 전년 비교 공시
Why can cloud sales surge before cash catches up?
Azure revenue grew 48%, while the broader Microsoft Cloud generated $63.9 billion. Google Cloud revenue rose 103% to $30.709 billion. The reporting scopes differ, so their totals are not a clean competitiveness ranking. TPU system sales also contributed to Google Cloud growth, and one-off hardware sales collect cash differently from rented computing services. Source: Microsoft IR Source: Alphabet SEC
There is an economic reason to invest early. Providers need servers, power and cooling before promising computing capacity to large customers. Delaying can hand customers to a rival. This explains why spending can precede revenue; it does not establish that every project will earn its cost back.
The income statement spreads equipment costs over its useful life through depreciation. Cash may leave now while accounting expenses persist for years. Low utilization can turn today’s cash burden into tomorrow’s margin pressure. Filling capacity and collecting usage fees can improve that outcome.
-
1
Build capacity
Pay for servers, power and cooling
-
2
Deliver services
Turn backlog into revenue
-
3
Collect payment
Utilization and terms matter
Remaining performance obligations, or RPO, represent contracted work not yet recognized as revenue. Microsoft’s commercial RPO was $677 billion. That supports demand visibility, but it is not cash in the bank. Contract duration, customer concentration and payment terms determine when cash arrives. Source: Microsoft RPO
What the CFOs said: spending rises, monetization lags
On October 28, Microsoft CFO Amy Hood said Microsoft Cloud revenue growth accelerated to 30%. Alphabet CFO Anat Ashkenazi retained 2026 capex guidance of $195–205 billion and expected a significant increase in 2027. The latter figures describe plans, not completed spending. Source: Microsoft CFO 발언 Source: Alphabet 발표 전문
Alphabet also expects near-term margin pressure from third-party computing capacity. Chief Business Officer Philipp Schindler said weaker monetization in AI Mode contributed to slower search-ad growth. More usage does not automatically translate into proportionately more revenue. Source: Reuters 실적 보도
The macroeconomic effects run in two directions. Data-center construction supports demand for equipment and electricity. Delayed returns create choices among cash reserves, borrowing, new equity and lower shareholder distributions. Borrowing adds interest costs; equity can dilute existing holders. These are possible financing channels, not a claim that either company has announced a new transaction.
This connects with our earlier discussion of AI investment and leverage. As investment expands, funding costs and cash-recovery periods matter more. Alphabet held $265.098 billion in cash, cash equivalents and marketable securities at September-end, and trailing twelve-month FCF remained positive. One negative quarter alone does not establish an imminent funding crisis. Source: Alphabet 유동성 공시
Korean suppliers: contract terms can change before revenue
The following is a transmission analysis, not an earnings forecast. HBM is stacked memory that feeds data rapidly to AI processors. Higher investment can support memory demand, but capex also includes buildings, power and networking. A 10% rise in total spending need not produce a 10% rise in Korean HBM orders.
A customer conserving cash may delay new orders or renegotiate payment terms before canceling entire projects. Memory suppliers need to track customer volumes and product prices; equipment makers need to watch acceptance milestones and final payments. Recorded sales can still tie up cash when receivables rise.
Power equipment follows a different timetable. Sites already under construction may still need grid connections, while delayed new sites can postpone future orders. Existing backlog and new orders therefore deserve separate attention. Semiconductor equipment also depends on chipmakers’ own expansion decisions, creating another lag.
Memory and HBM
Customer product mix
Demand
Cash · Prices, advances, inventory
Power and equipment
Existing builds vs new starts
Timing
Cash · Acceptance and final payment
Suppliers must finance their own capacity too. Our discussion of Solidigm’s IPO halt and funding choices examined this issue. If customer orders slow while depreciation and interest costs continue, a modest revenue shortfall can have a larger impact on earnings.
Three checks when Korean stocks price in optimism first
CNN Fear & Greed stood at 34.9, Fear, on October 29, up from 20.0 a week earlier and 31.1 a month earlier. GoldKimp’s KOSPI measure was 76.1, Extreme Greed, on October 28. Different methodologies prevent a direct trading comparison, but the contrast is useful when assessing whether Korean supplier expectations have run ahead of customers’ cash generation. Source: CNN 스냅샷 기준 Source: GoldKimp 스냅샷 기준
Comparable weekly and monthly Korean readings were unavailable. We also checked SentimenTrader’s public Smart Money and Dumb Money Confidence dashboard on October 30; values and the update date were blank. We therefore draw no conclusion about their relative confidence. Source: SentimenTrader 확인 페이지
Watch whether customers maintain investment plans, whether backlog converts into revenue and cash, and whether Korean suppliers control deliveries, inventories and receivables. Sustained spending plus faster collection supports earnings expectations. Orders rising alongside even faster inventory and receivable growth deserve more scrutiny.
AI investment supports construction and equipment demand today and could reduce business costs over time. The pace at which productivity gains reach wages and consumption is a separate question. These two earnings reports do not establish a broad Korean consumption recovery. Our view is to read cloud growth alongside customer FCF and contract terms when assessing AI suppliers. This is analysis, not a recommendation to buy or sell a security.
Sources and references
- Microsoft FY27 Q1 실적 발표 · 2026-10-28
- Microsoft SEC Exhibit 99.1 · 2026-10-28
- Alphabet Q3 2026 SEC Exhibit 99.1 · 2026-10-28
- Reuters: Alphabet cash burn and AI spending · 2026-10-28
- Alphabet Q3 실적발표 전문 재전재 · Investing.com · 2026-10-28
- Stock Titan: Microsoft FY27 Q1 · 2026-10-28
- CNN Fear & Greed · 2026-10-29
- GoldKimp KOSPI Fear & Greed · 2026-10-28
- SentimenTrader 공개 대시보드 · 2026-10-30 확인
For information only — this is not a recommendation to buy or sell any asset.
Comments 0